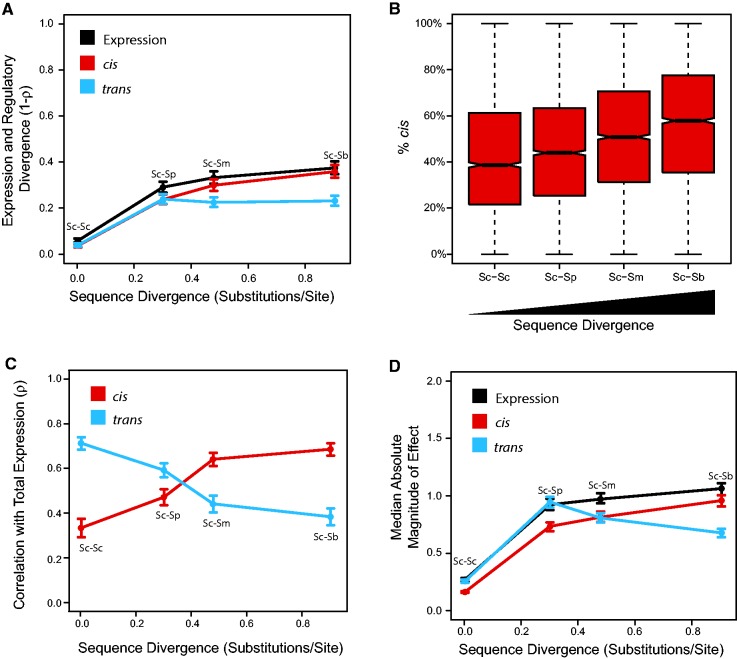
Fig. 1.—
cis-regulatory differences become the dominant form of regulatory divergence between species. (A) Total expression and regulatory divergence over time. Divergence in gene expression and regulation were calculated as one minus Spearman’s rho. Sequence divergence was calculated from 4-fold degenerate sites within coding regions. Error bars are 99% CI from bootstrap analysis. (B) Percent of total regulatory divergence due to cis-regulatory differences. Notches in box plots represent 95% CI for the median. (C) Correlation between total expression divergence and cis-regulatory divergence or trans-regulatory divergence. Error bars are 99% CI from bootstrap analysis. (D) Median absolute magnitude of difference in total expression and regulation. Error bars are 99% CI from bootstrap analysis. Black: Total expression, Red: cis-regulatory, Blue; trans-regulatory. Sc: S. cerevisiae. Sp: S. paradoxus. Sm: S. mikatae. Sb: S. bayanus.

