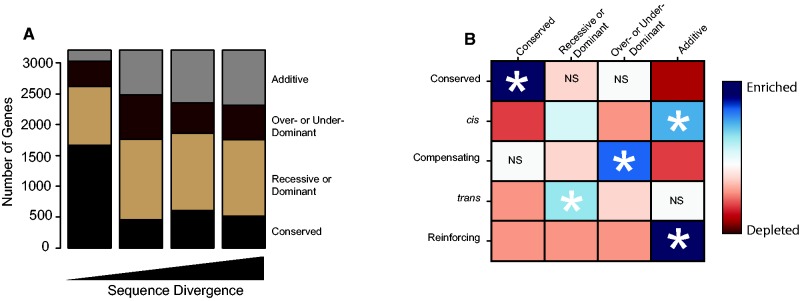
Fig. 3.—
Mode of inheritance and mechanism of regulatory divergence are closely related. (A) Number of genes within each mode of inheritance category versus sequence divergence. Genes were classified into one of four categories based on statistical support: Black, conserved. Light brown, dominant/recessive. Dark brown, misexpressed. Gray, additive. (B) Comparison of regulatory divergence categories and modes of inheritance categories. Mode of inheritance categories are on the top. Intersections show magnitude of enrichment (blue) and depletion (red) of genes within each combination of regulatory and inheritance categories. Asterisks mark the strongest enrichment for each regulatory divergence category. Statistical significance of enrichment and depletion is shown by the brightness of each box, with NS signifying nonsignificant effects and darker colors corresponding to lower P values. All categories not marked by NS are significant at less than a Bonferroni corrected P value of 0.0005.

