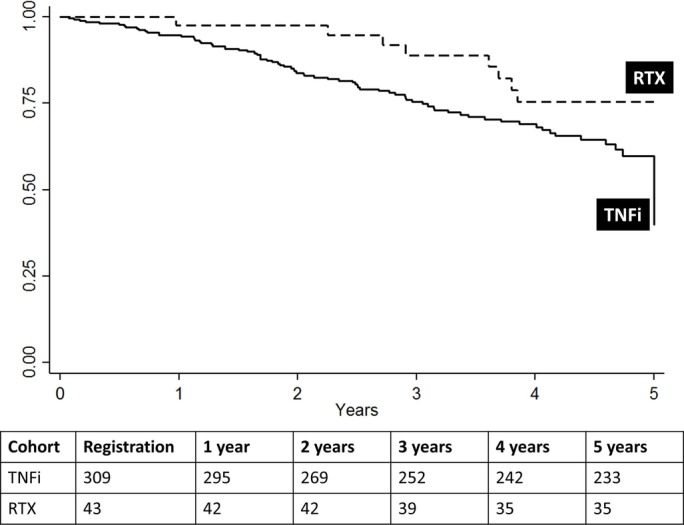
Figure 1.

Kaplan-Meier survival curves for death following exposure to TNFi or RTX over the first 5 years following therapy commencement, within an intention to treat analysis. Numbers in table represent the number of patients at risk of death at the specific follow-up time points. RTX, rituximab; TNFi, tumour necrosis factor inhibitor.
