
Figure 2.
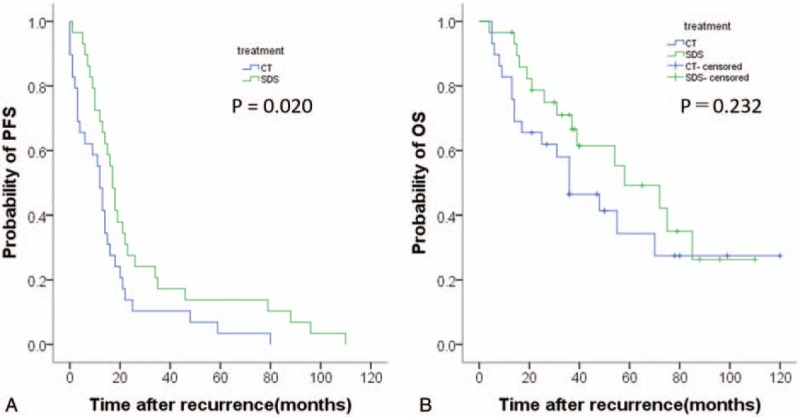
Kaplan–Meier survival curves for estimating the probability of (A) progression-free survival and (B) overall survival after treatment with secondary cytoreductive surgery plus chemotherapy (N = 29) versus chemotherapy alone (N = 29) in a propensity score-matched cohort.