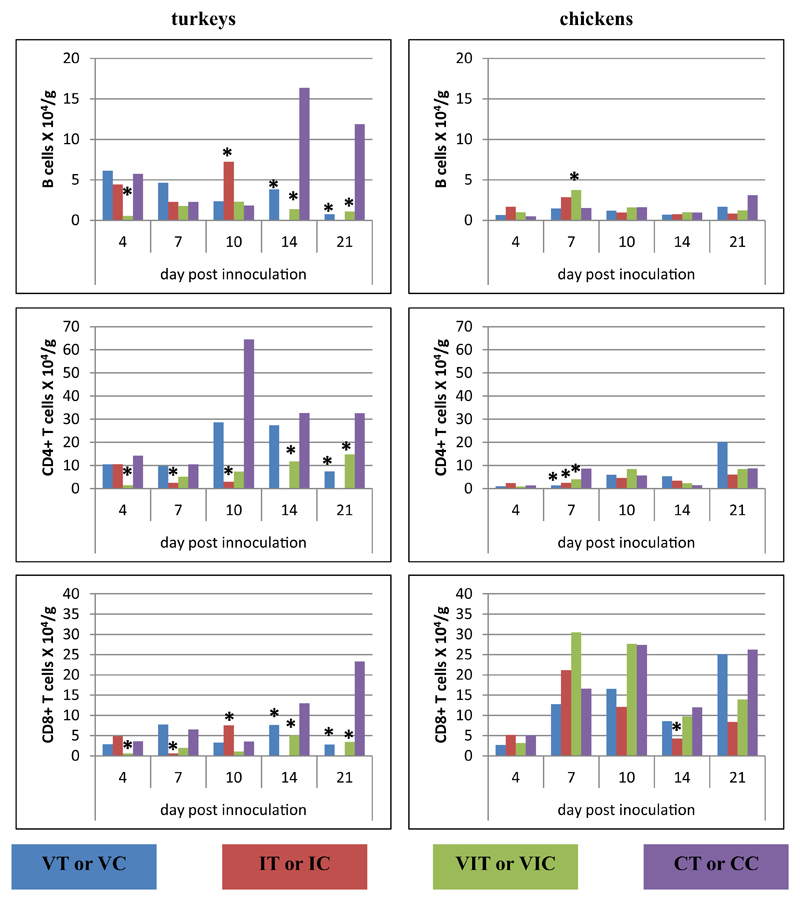
Fig. 4.
Alterations of B cells, CD4+ and CD8α+ T cells following vaccination and/or infection analysed by flow cytometry in the caecum. Absolute cell numbers of B cells (CD3ε−MHC-II+, turkey; CD3ε−Bu1+, chicken), CD4+ T cells (CD3ε+CD4+CD8α−) and CD8α+ T cells (CD3ε+CD4−CD8α+) were determined in groups of vaccinated turkeys (VT), vaccinated chickens (VC), infected turkeys (IT), infected chickens (IC), vaccinated and infected turkeys (VIT), vaccinated and infected chickens (VIC), control turkeys (CT) and control chickens (CC). Data represent the mean absolute cell number of 3 birds/group. *Significant different to control group of the respective species (P ≤ 0.05).

