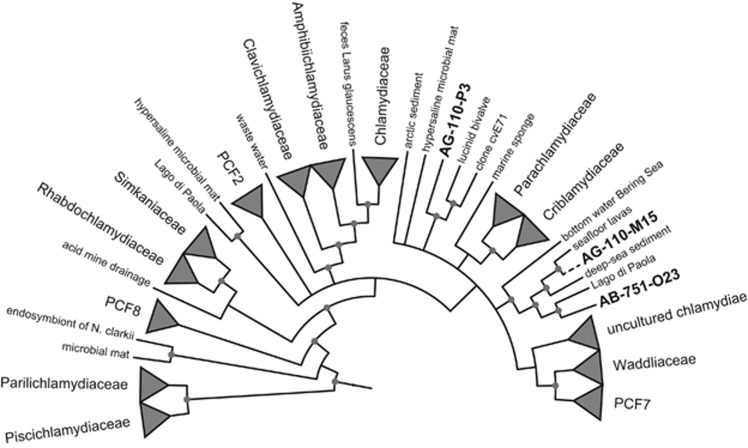
Figure 1.
Marine SAGs representing deeply branching chlamydiae. A Bayesian 16S rRNA-based phylogenetic tree is shown, indicating the relationship of the three marine SAGs with known chlamydiae. SAG AG-110-M15 is represented by a partial sequence added to the main tree (dashed line), which included only near full-length sequences. Circles indicate nodes with posterior probabilities >95%. A dendrogram of the tree including branch lengths, posterior probabilities and accession numbers of terminal node sequences is available as Supplementary Figure S1.

