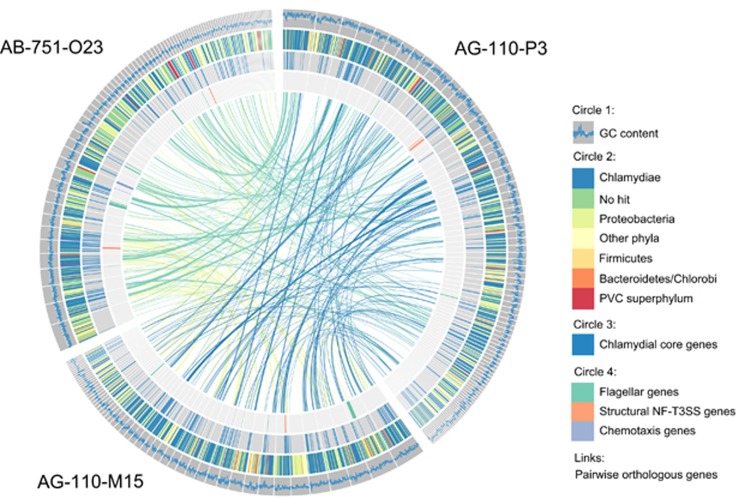
Figure 2.
Taxonomic profile of chlamydial SAGs and distribution of selected genes. The outer circle (circle 1) illustrates the GC content in a sliding window of 500 nucleotides; for reference, the white line indicates a GC content of 40%. Circle 2 shows the phylum-level taxonomy of the first blast hit of each protein. Highly conserved genes belonging to the chlamydial core genome are indicated in circle 3. The genomic location of flagellar, NF-T3SS and chemotaxis genes is shown in the inner circle. The links represent pairwise orthologs between two SAGs.

