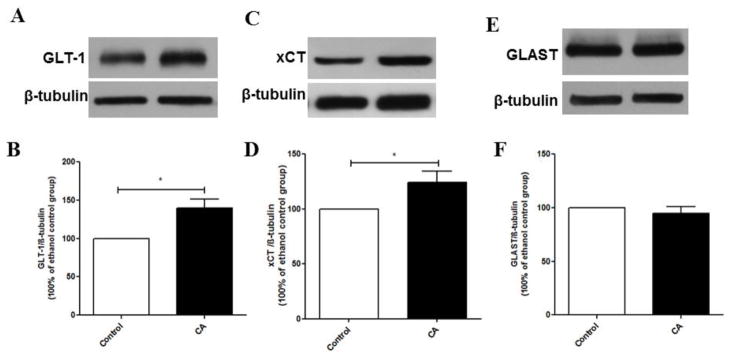
Figure 2.
Effects of CA treatment on GLT-1, xCT and GLAST expression in the NAc. (A, C, E) Immunoblots for GLT-1/β-tubulin, xCT/β-tubulin, and GLAST/β-tubulin, respectively. (B) Quantitative analysis for the immunoblots revealed a significant upregulation of GLT-1 expression in the CA treated group as compared to control group in the NAc. (D) Quantitative analysis for the immunoblots revealed a significant upregulation of xCT expression in the CA treated group as compared to control group in the NAc. (F) Quantitative analysis for the immunoblots revealed no significant difference in GLAST expression between CA treated group and control group in the NAc. Data are represented as mean ± SEM, (*p < 0.05); (n=7 for each group).

