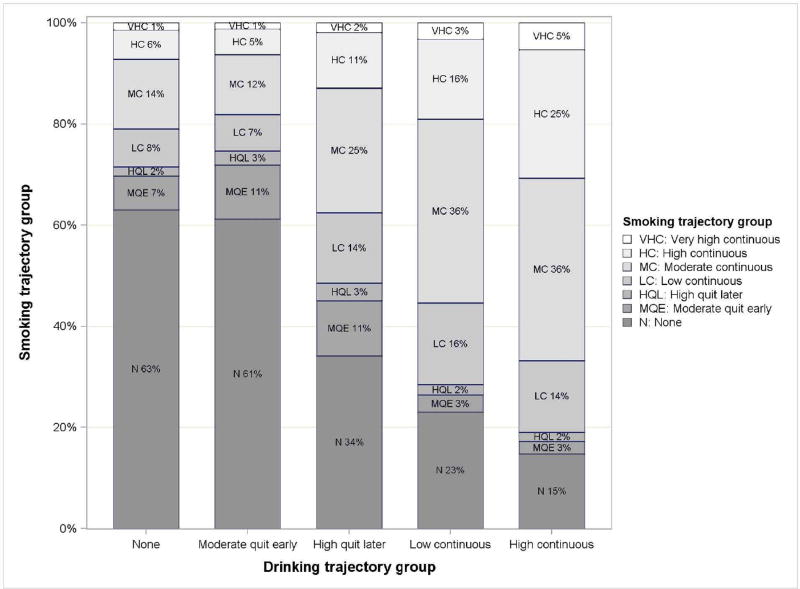
Fig. 4.
Pregnancy smoking by drinking trajectory groups (n = 11,692 pregnancies). For the five drinking groups, values in the bars indicate the percentage of pregnancies assigned to each of the seven smoking groups (e.g., “N 63%”: of pregnancies assigned to the None drinking group, 63% were also assigned to the None smoking group).

