
Figure 1.
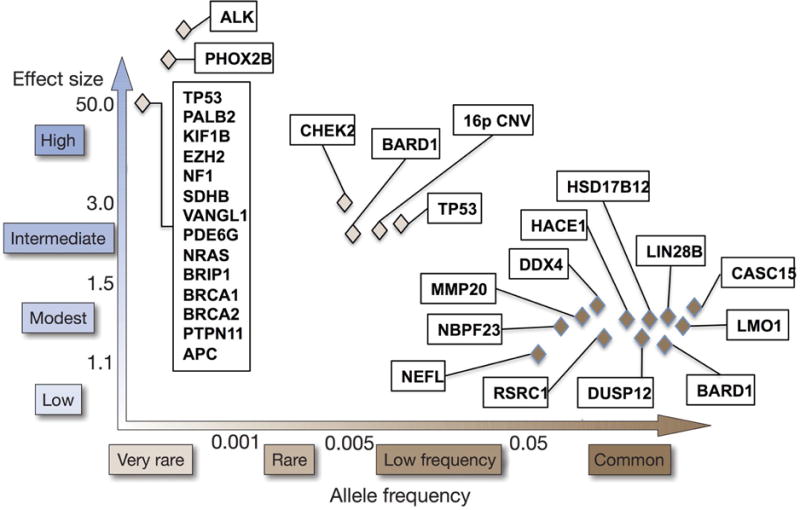
Graphical representation of genetic predisposition to neuroblastoma. Known familial and sporadic predisposition genes have been compiled into one summary figure across multiple studies. The familial mutations are shown in the top left of the graph representing a very rare allele frequency and high effect size. GWAS-discovered variations are in the bottom right corner representing a higher allele frequency with a lower effect size. Continued sequencing efforts are likely to uncover additional rare susceptibility variants along this spectrum, of which dozens are predicted to be discovered to explain the heritability of neuroblastoma.