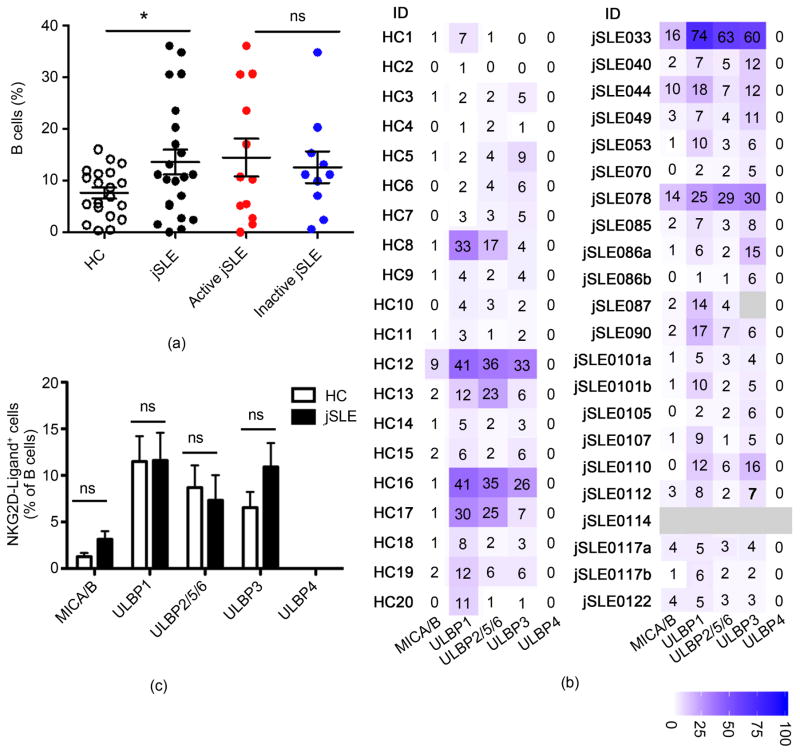
Figure 1.
Frequencies and NKG2DL phenotypes of peripheral blood B cells in juvenile-onset SLE patients and healthy controls (HC). (a) Comparisons of proportions (% of total lymphocytes) of B cells in HC to those in jSLE patients, and between active and inactive disease. Horizontal lines and error bars show median and interquartile range. (b) Heat map display of proportions (numbers in individual squares) of B cells expressing the indicated NKG2D ligands in each patient and control sample. Light grey indicates no data; bar displays color grading; (ID) identification. (c) Graphic display of proportions of B cells expressing the indicated ligands. (a)–(c) *p < 0.05; (ns) not significant.

