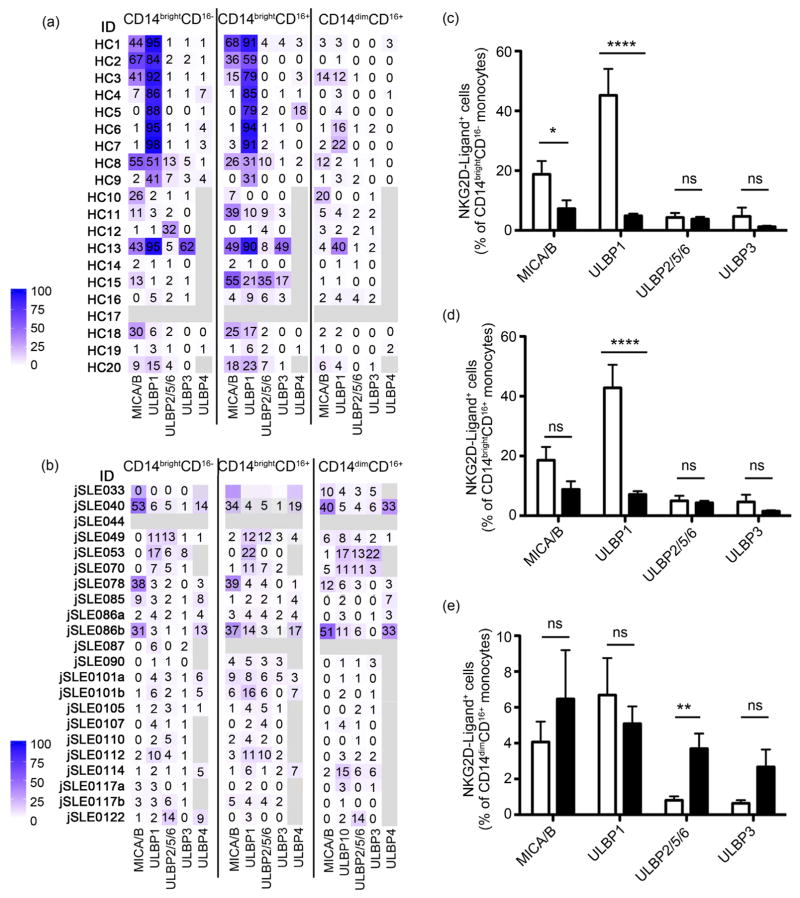
Figure 3.
NKG2DL phenotypes of peripheral blood monocytes in juvenile-onset SLE patients and healthy controls (HC). (a) (b) Heat map display of proportions (numbers in individual squares) of CD14/CD16-defined monocytes expressing the indicated ligands in each HC (a) or jSLE patient (b) sample. Bars display color grading. Light grey indicates no data; (ID) identification. (c)–(e) Graphic display of proportions (in %) of (c) CD14brightCD16−, (d) CD14brightCD16+, and (e) CD14dimCD16+ monocytes expressing the indicated ligands. Open and black bars represent data from HC and patients, respectively. *p < 0.05; **p < 0.01; ****p < 0.0001; (ns) not significant.

