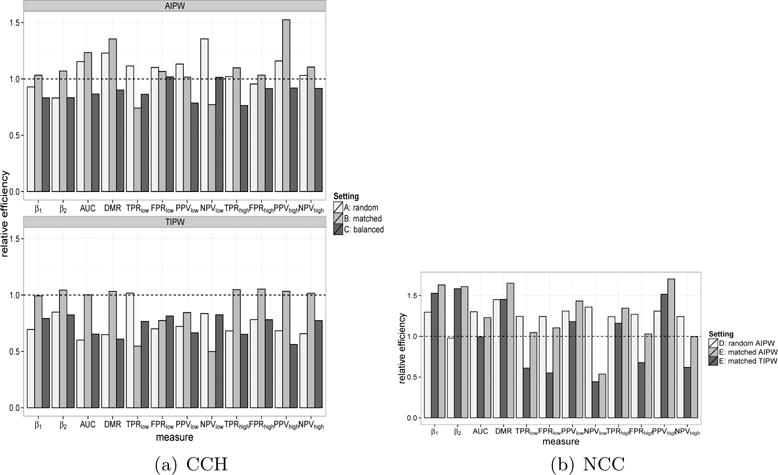
Fig 1.

Relative efficiency (RE) of various predictive performance summaries by different designs. Figure (a): results for CCH designs. Setting A: simple random sampling; Setting B: matched design and Setting C: balanced design. TIPW (top panel) and AIPW (bottom pane) estimators for each setting are considered, using TIPWopt as benchmark for efficiency. Figure (b) results for NCC designs. Setting D: simple random sample; Setting E: matched design. TIPW estimator under setting D is the benchmark for efficiency.
