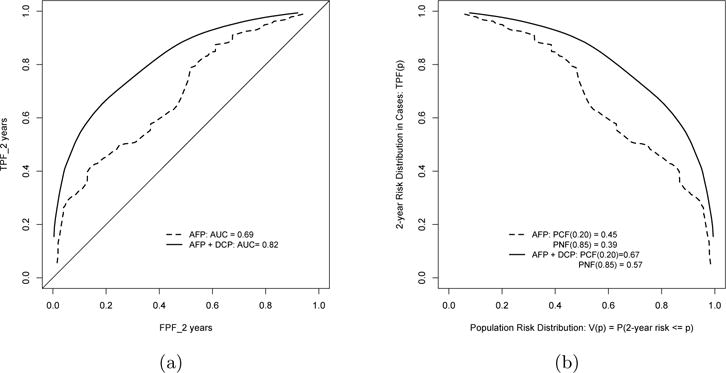
Fig 2.

Comparing performance of two prediction models: model with AFP along (solid lines) and model with both AFP and DCP (dashed lines). (a) ROC curves for predicting 2-year risk of HCC with baseline biomarker measurements. (b): risk distribution curves for individuals who diagnosed with HCC in 2 years.
