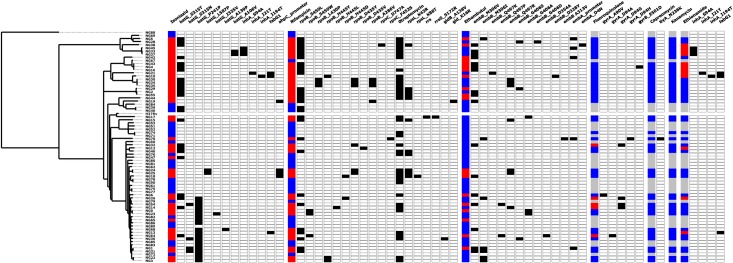
Fig 3. Molecular mechanisms of resistance to first- and second-line anti-TB drugs.
A heatmap showing the phenotypic susceptibility profiles to first- and second-line anti-TB drugs and the presence of known resistance mutations. Blue = phenotypically susceptible, Red = phenotypically resistant, Black = presence of resistance mutation, white = absence of resistance mutation and grey = no phenotypic testing.

