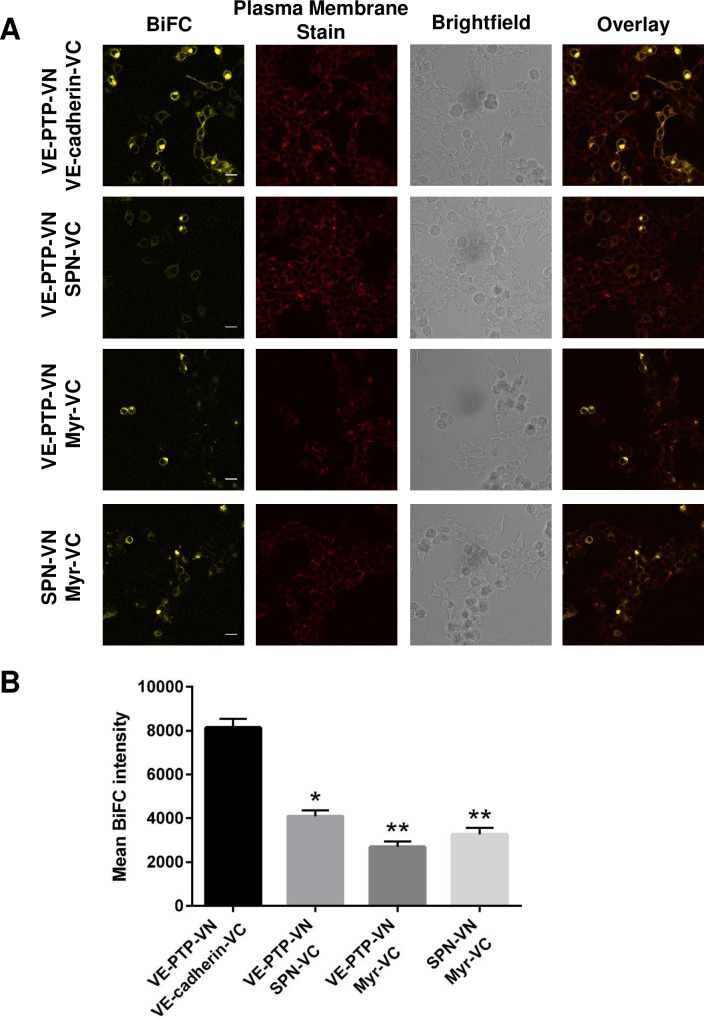
Fig 4. Comparison of BiFC signals from the VE-PTP and VE-cadherin with VE-PTP and control constructs.
(A) Pairs of constructs were transfected into HEK-293T cells and the BiFC signal assessed. Plasma membrane staining, brightfield and overlayed images are shown on additional panels. Data are representative of at least three independent experiments; scale bar 20 μm. (B) Bar graphs represent the average BiFC fluorescence intensity from all cells in three images taken from three independent experiments determined as described in the materials and methods. Values are means ± S.E.M; * P<0.005 and ** P<0.001 by the Mann-Whitney U test.

