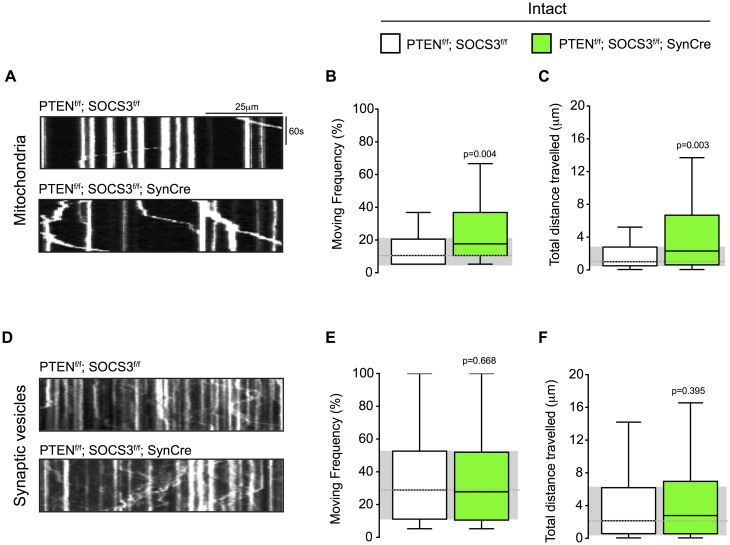
Fig 4. PTEN and SOCS3 co-deletion increased mitochondrial transport in cultured neurons whose axons were not severed.
(A-C) Representative kymographs (A) and quantification of moving frequency (B) and distance travelled (C) from live imaging of mitochondria in PTENf/f; SOCS3f/f and PTENf/f; SOCS3f/f; SynCre in intact axons. Mann-Whitney U test on the number of mitochondria. n = 117–118 mitochondria from 13–14 axons and 4–5 individually cultured embryos from 2 independent experiments. (D-F) Representative kymographs (D) and quantification of moving frequency (E) and distance travelled (F) from live imaging of synaptophysin-positive synaptic vesicle in intact axons of indicated genotype. Mann-Whitney U test. n = 123–212 synaptophysin-positive synaptic vesicles from 13–14 axons and 4–5 individually cultured embryos from 2 independent experiments.

