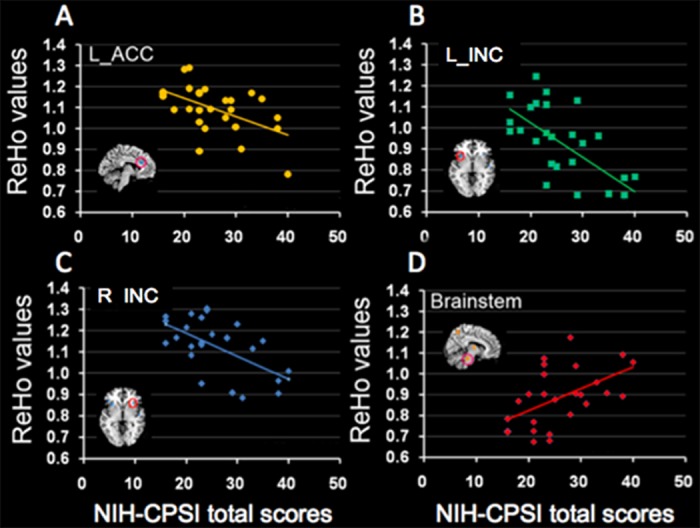
Fig 3. Relationships between mean ReHo values and NIH-CPSI total scores.

In the CP/CPPS-patients, there were significantly negative correlations between the NIH-CPSI total score and the mean ReHo value in the left ACC (r = -0.52, p = 0.005) (A), left INC (r = -0.64, p < 0.001) (B) and right INC (r = -0.57, p = 0.002) (C), while a significantly positive correlation between the NIH-CPSI total score and the mean ReHo value in the brainstem (r = 0.52, p = 0.005) (D).
