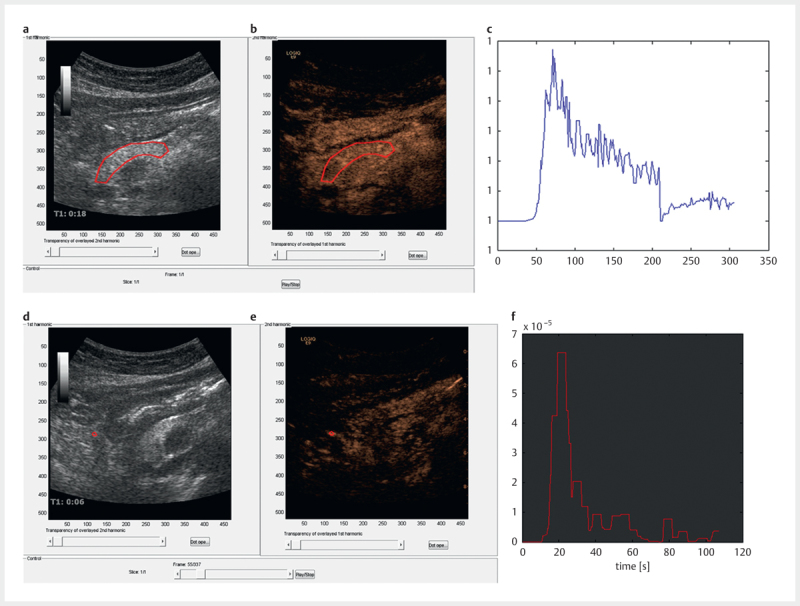
Fig. 1.

Panels a - c show the pancreatic B-mode image a , contrast image b and the time intensity curve c of the region of interest (ROI, red). In panels d - f the corresponding images are shown for an artery (in red) used for scaling the dataset in a study using ultrasound and contrast agents.
