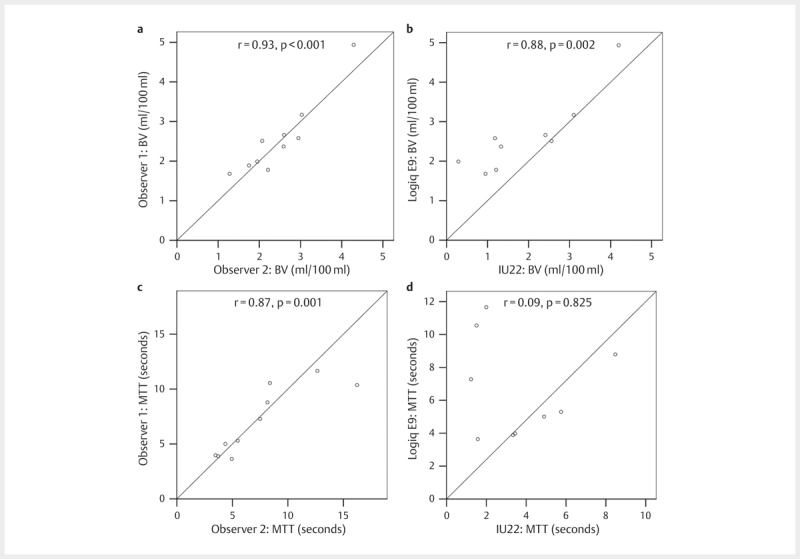
Fig. 2.

Panels a and b show correlations for blood volume (BV) between observer 1 and 2 on the Logiq E9 and between Logic E9 and IU22, respectively, in a study using ultrasound and contrast agents to improve pancreatic imaging. Panels c and d show the corresponding correlations for mean transit time (MTT).
