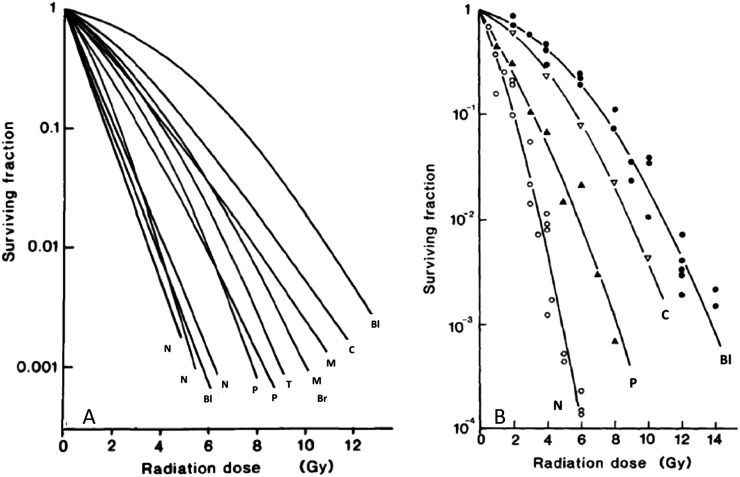
Figure 2.
(a, b) Cell survival curves for various different human tumour cell lines treated with a single dose of radiation. (b) Data are fitted with the linear-quadratic model of cell survival. Br, breast; Bl, bladder; C, cervix; M, melanoma; N, neuroblastoma; P, pancreas; T, teratoma. Modified from Steel148 and Steel et al149 with permission from Elsevier.

