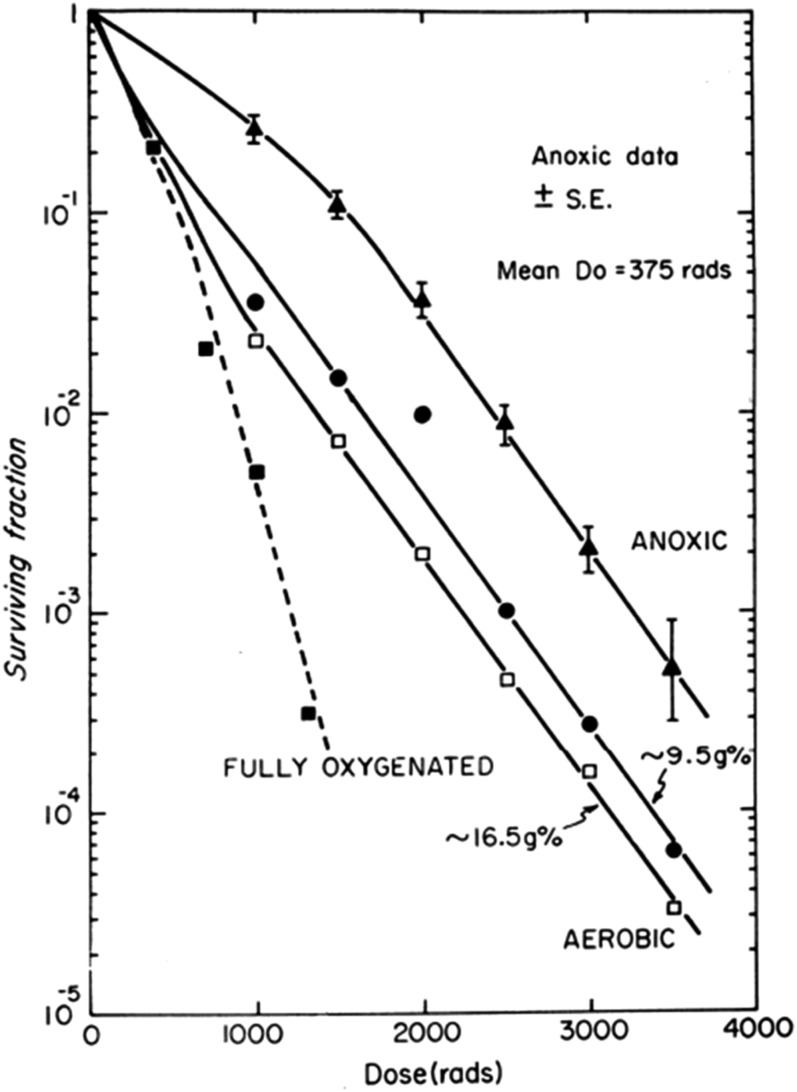
Figure 4.
Tumour cell response to irradiation when cells are removed from the tumour for analysis of clonogenic capacity immediately after irradiation. The figure demonstrates: (1) the effect of making the tumour hypoxic immediately before irradiation (anoxic), (2) the effect of different levels of haemoglobin in the blood of mice on the fraction of hypoxic cells in tumours in air-breathing animals. Survival curve for fully oxic cells is shown for comparison. Reproduced from Hill et al44 with permission from British Institute of Radiology. Do, slope of the survival curve; SE, standard error.

