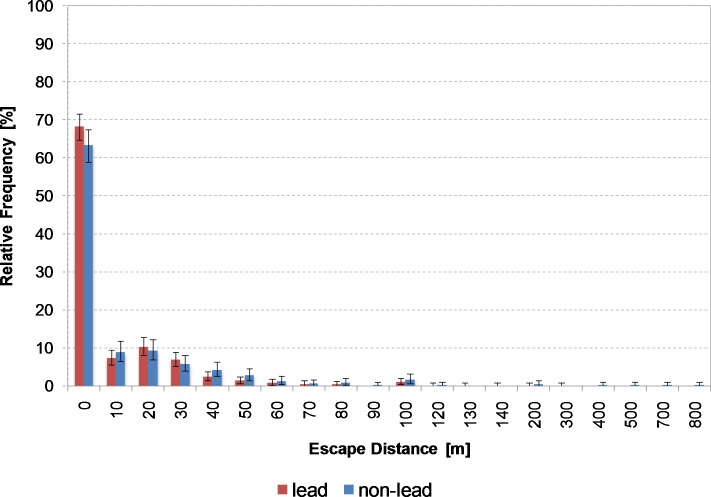
Fig 2. Distribution of escape distances of roe deer with 95% confidence interval.
From escape distances above 100 m, ticks on the horizontal x axis are no longer divided into classes of 10 m. Reports of escape distances above 100 m were rare. Escape distances of 0 m also contains distances from 1 to 9 m.

