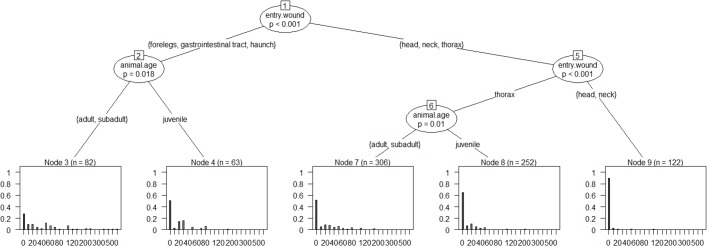
Fig 10. Inference tree for assessment of the factors that influence the escape distance of wild boar (including animals that remained on the spot).
The inference tree can be read from top to bottom. The number of the splits (nodes) is shown in the boxes (e.g. 1). Significant variables are indicated at the splits with the significance level in the ellipses. Connections between the nodes show the group distributions. The escape distance is shown as the end node of the inference trees with the help of relative frequencies (with details of the sample size n).

