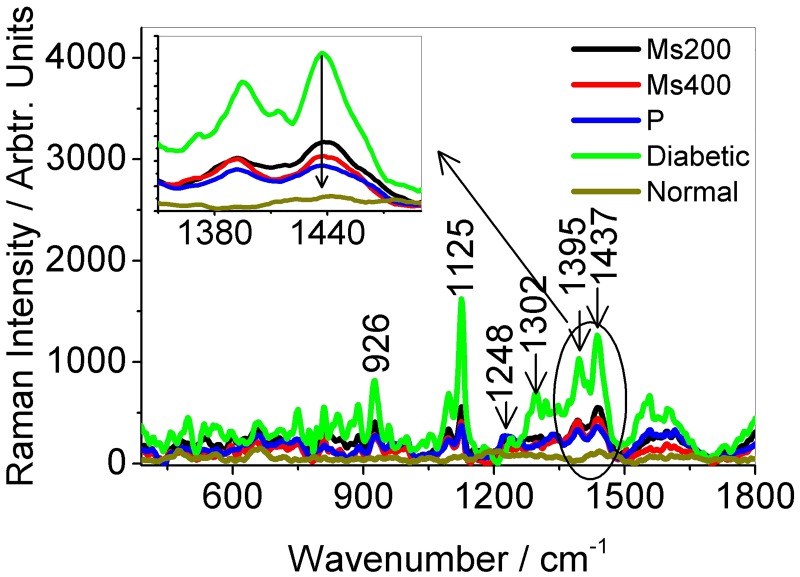
Fig 3. Figure showing the avarage Raman spectra (average of five spectra each) from diabetic rats given anti-diabetic drug pioglitazone (P), herbal extracts Momordica spinosa (Gilg.)Chiov. at concentrations of 200 mg/ kg (Ms200) and 400 mg/kg (Ms400) of body weight.
Spectra from non-diabetic rats (Normal) is also given. The inset shows the changes in intensity at peaks centered at wavenumbers 1437 cm and 1395 cm−1.

