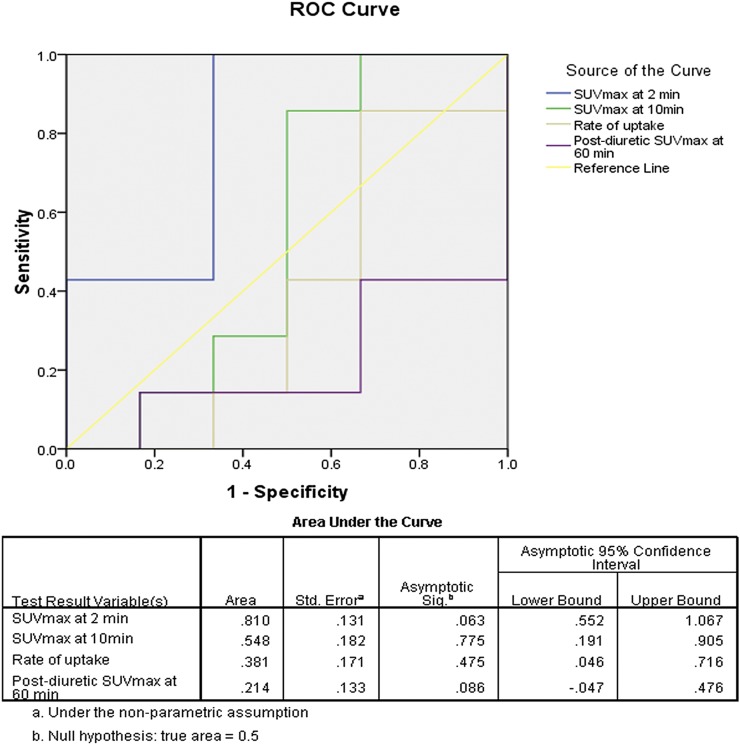
Figure 3.
The figure depicts the receiver-operating characteristic (ROC) curve analysis of maximum standardized uptake value (SUVmax) at 2 min, 10 min, 60 min and rate of uptake. SUVmax at 2 min (a marker of tumour perfusion) was significantly different between low- and high-grade pT1-stage bladder tumours (p-value 0.04) (Table 1). It demonstrates that SUVmax at 2 min (area under the curve 0.810) has the potential to differentiate high-grade from low-grade pT1 lesions unlike other variables such as SUVmax at 10 min, at 60 min and rate of uptake.

