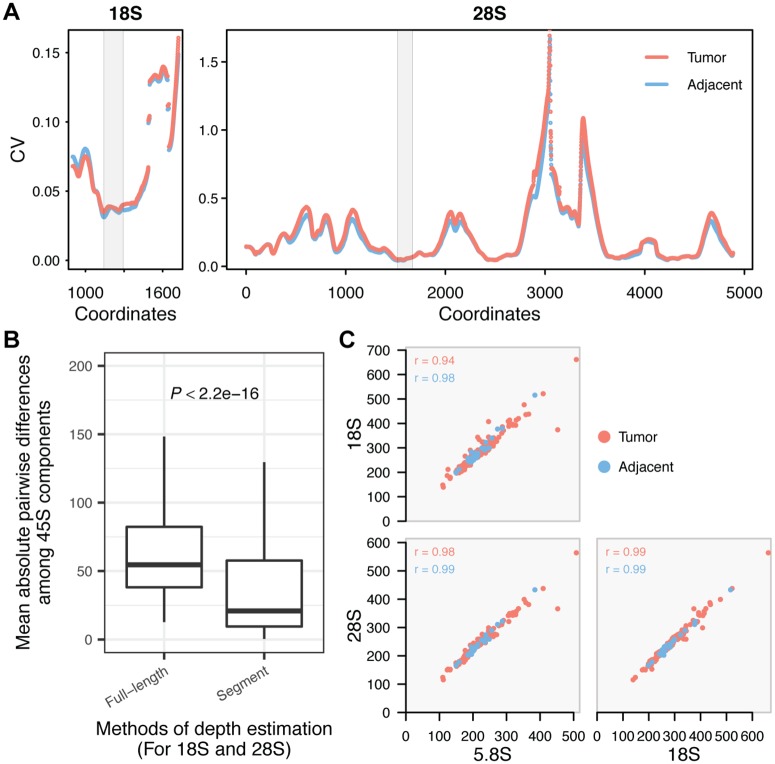
Fig 1. Estimating rDNA copy number.
(A) For each 150bps window along the rDNA array reference, we calculated the coefficient of variation (CV) of the average depth among samples. The x-axes indicate the starting coordinate for each window on 18S (901–1871) and 28S (whole length). LUAD tumor and adjacent tissues have largely consistent CV across 18S and 28S sequences. The grey regions highlight the windows selected to assess CN in the 18S and 28S components. (B) The differences in copy number among the three 45S components in each sample were calculated as the mean of their absolute pairwise difference. Such differences are significantly smaller when using the selected segments than using the full length of the rDNA shown in (A) for 18S and 28S. (C) Nearly perfect pairwise Pearson correlations between 45S components. BLCA is displayed as an example. Copy number estimates are corrected for batch and ploidy.

