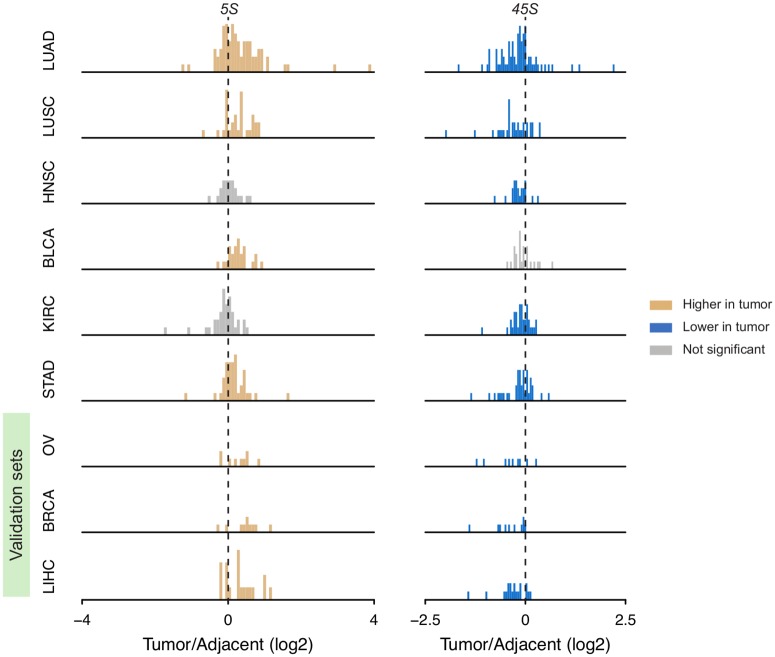
Fig 3. rDNA CN amplification and loss between cancer tissue and paired adjacent normal tissue.
Yellow and blue denote significant gain or loss in tumors compared with paired adjacent controls (one-sided paired Wilcoxon rank sum test P < 0.05 for OV and < 0.01 for others). There are 74, 32, 22, 24, 35, 38, 9, 10 and 19 informative patients for LUAD, LUSC, HNSC, BLCA, KIRC, STAD, OV, BRCA and LIHC respectively. OV, BRCA and LIHC were used as validation sets.

