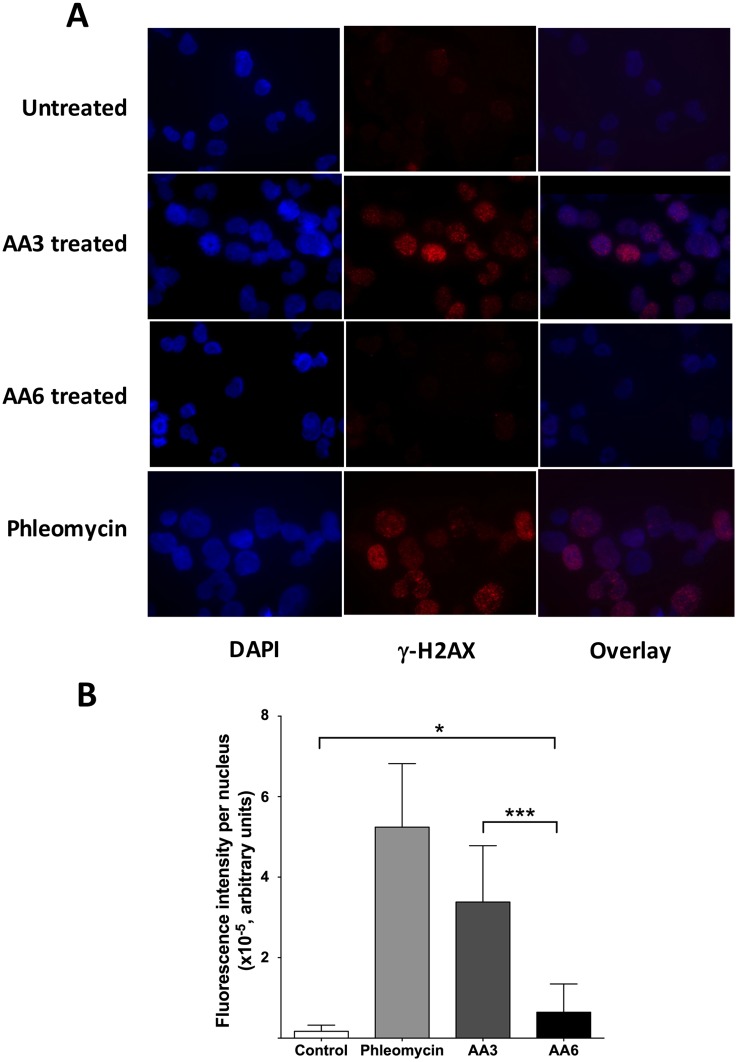
Fig 5. Detection of γ-H2AX in Daudi cells following AA3 treatment.
(A) Daudi cells were stained with anti-γ-H2AX antibodies and visualized using immunofluorescence. Untreated cells are compared with AA3- or AA6-treated, or Phleomycin-treated cells. Representative images of cells stained with DAPI (blue), anti-γ-H2AX antibodies labeled with Cy3 (red) and the overlay of the two images are shown. (B) Quantification of γ-H2AX nuclear fluorescence intensity. The total number of cells used for quantification- Untreated, 74; AA6-treated, 70; AA3-treated, 184 and Phleomycin-treated, 122. Mean intensity and standard deviation for each cell type is shown.

