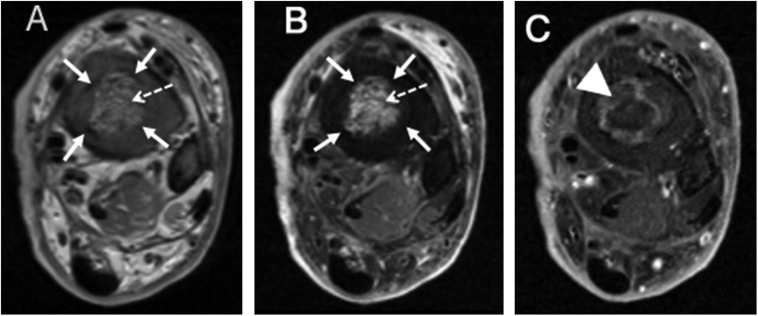
Figure 5.
Axial proton density (a), axial T2 fat-saturated (b) and axial T1 fat-saturated post-contrast images (c) of the distal tibia: proton density and T2 fat-saturated images demonstrate the peripheral line of low signal intensity representing the sclerotic tissue (solid arrows) surrounding a central region of marrow oedema (dashed arrows). On T1 fat-saturated post-contrast images, deep to the low signal sclerotic tissue, there is a circumferential band-like region of enhancement representing a zone of hyperaemia (arrowhead).

