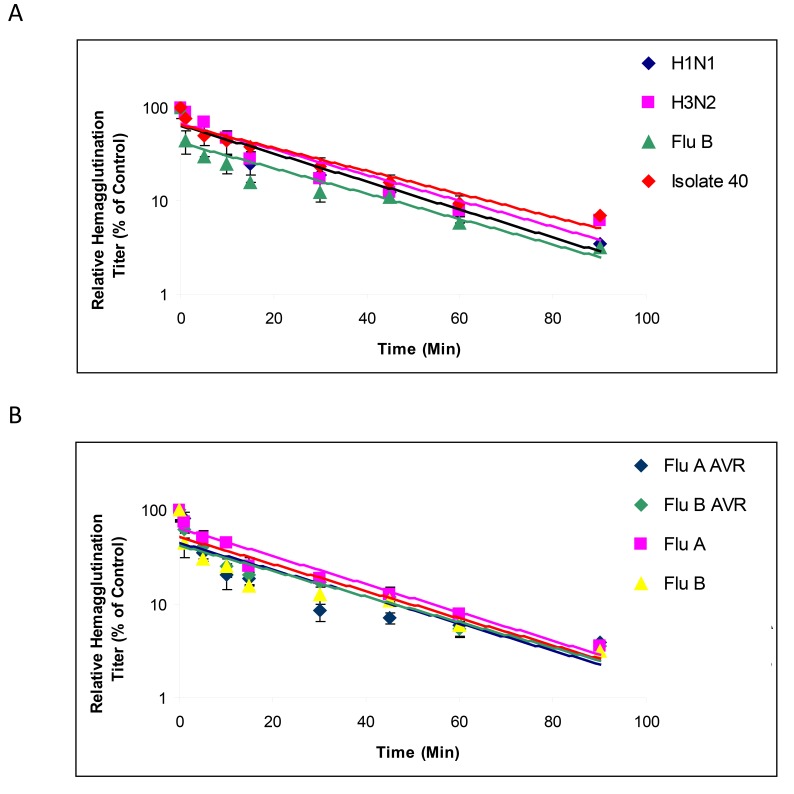
Figure 2.
Semi-logarithmic time-kill curves of influenza exposed to EC50 concentrations of CPC at increasing exposure times are shown. The resulting percentage of hemagglutination compared to control is shown over time with mean and standard deviation reported at the indicated time post CPC at EC50. The trend line displays the rate of inactivation for each virus. A) Fifty percent of infectious virus was inactivated in the first 5 minutes of exposure for all isolates except for FluB. Isolate 40 is a clinical strain of influenza A (H1N1pdm09) virus propagated from a patient sample. B) Time-kill curve between oseltamivir-resistant and susceptible strains. No difference in CPC susceptibility was seen between strains, n = 3 experimental replicates.

