Figure 2.

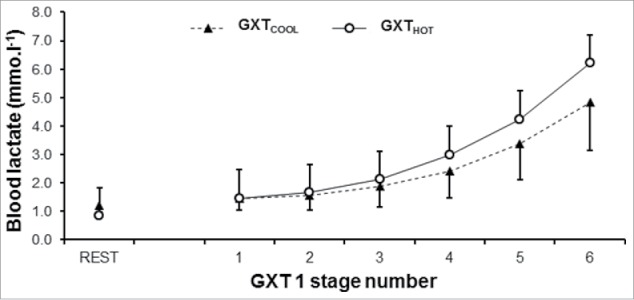
Mean ( ± SD) blood lactate response during graded exercise in hot conditions, compared with cool conditions. Error bars represent one standard deviation.

Mean ( ± SD) blood lactate response during graded exercise in hot conditions, compared with cool conditions. Error bars represent one standard deviation.