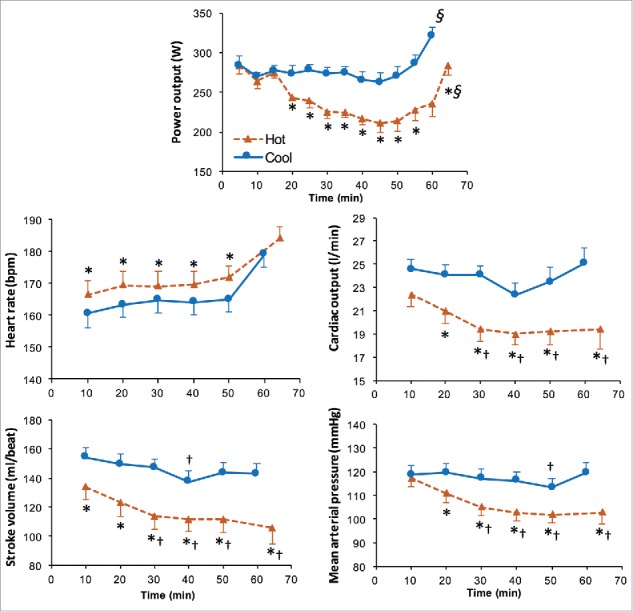
Figure 4.

Power output and cardiovascular response during a 40-km cycling time trial in Hot (35°C) and Cool (20°C) conditions. Values are means ± SD for 8 subjects. ∗Significantly different from Cool (P < 0.05). §Significantly higher than previous (P<0.01). †Significantly lower than 10 min (P < 0.05). Reproduced with permission from Périard et al.17
