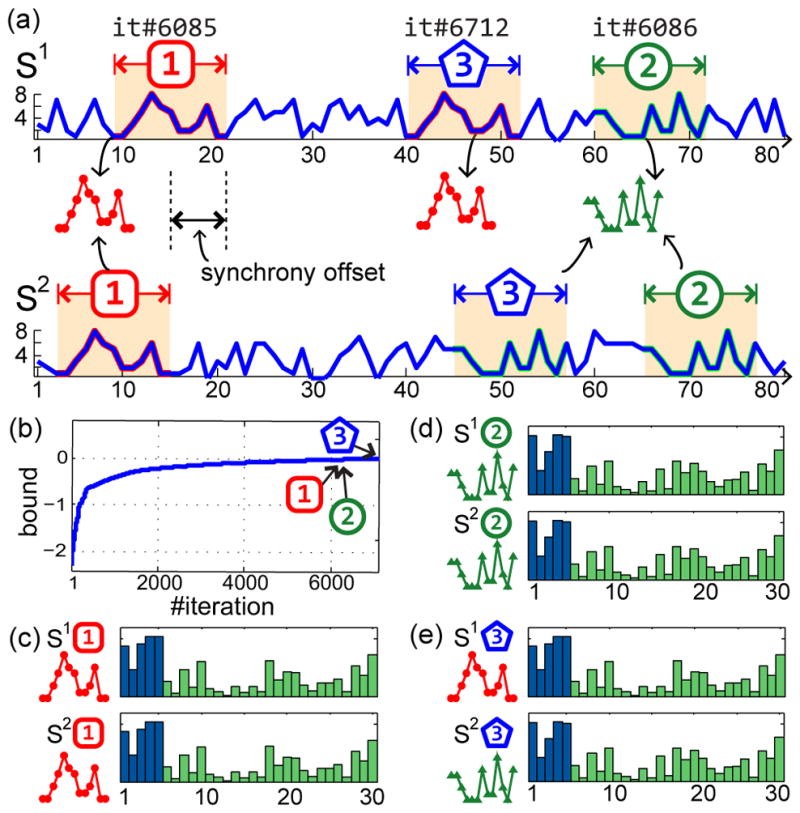
Fig. 4.

An example of SD on two 1-D time series using ℓ=13 and T = 5: (a) Top 3 discovred synchronies at different iterations; exhaustive search takes 39151 iterations. (b) The convergence curve w.r.t. bounding value and #iter. (c)~(e) Discovered synchronies and their histograms, where blue and green bars indicate the segment features ϕobs and ϕint, respectively. ϕint is 10X magnified for display purpose. The ℓ1 distances between the three histogram pairs are 6.3e-8, 1.5e-7, and 5.8e-2, respectively.
