. 2017 Sep 19;6:e24271. doi: 10.7554/eLife.24271

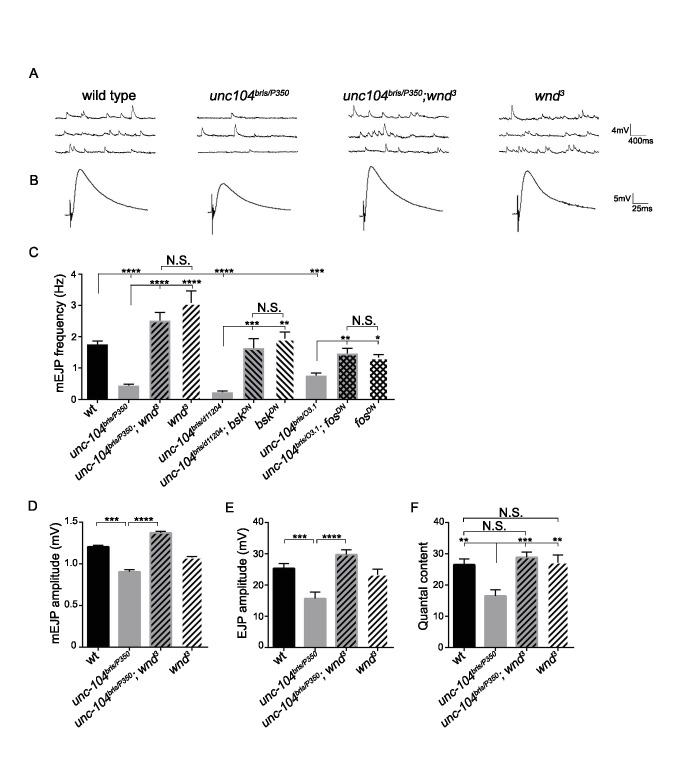
Figure 3. The synaptic transmission defect in unc-104 mutants is suppressed by wnd mutations.

(A–B) Representative electrophysiological traces of (A) miniature Excitatory Junctional Potentials (mEJP) and (B) Evoked Excitatory Junctional Potentials (EJP) recorded from muscle 6 of third instar larvae. (C) Quantification of impaired mEJP frequency for unc-104-hypomorph mutants and their rescue by wnd mutations or expression of dominant negative (DN) bsk or fos (driven by elav-Gal4 and BG380-Gal4, respectively). Representative traces for bskDN and fosDN are shown in Figure 3—figure supplement 1. (D–F) Quantification of (D) mEJP amplitude, (E) EJP amplitude and (F) quantal content (corrected for nonlinear summation). See also Figure 3—figure supplement 1 for additional quantification of bskDN and fosDN data. Unc-10403.1 and unc-104bris are hypomorphic alleles, while unc-104P350 and unc-104d11204 are null alleles. wnd3 is a presumptive null mutation in wnd (Collins et al., 2006). wt animals are Canton S. All data are represented as mean ±SEM; N.S., not significant; ****p<0.0001, ***p<0.001, **p<0.01, *p<0.05. Tukey test for multiple comparison. For additional data, see Figure 3—figure supplements 14.

Figure 3—source data 1. Measurements of EJP and mEJP.
The file contains data from 3 independent experiments and 6 source data sheets: EJP amplitude, corrected EJP amplitude and Quantal content, mEJP amplitude and frequency of CS, unc-104, unc-104;wnd and wnd. This is corresponding to Figure 3.
DOI: 10.7554/eLife.24271.012
Figure 3—source data 2. Measurements of EJP and mEJP.
The file contains EJP amplitude, corrected EJP amplitude and Quantal content, mEJP amplitude and frequency of CS, unc-104bris/d11204, unc-104bris/d11204;bskDN and bskDN. This is corresponding to Figure 3C and Figure 3—figure supplement 1.
DOI: 10.7554/eLife.24271.013
Figure 3—source data 3. Measurements of EJP and mEJP.
The file contains EJP amplitude, corrected EJP amplitude and Quantal content, mEJP amplitude and frequency of CS, unc-104bris/O3.1, unc-104bris/O3.1;fosDN and fosDN. This is corresponding to Figure 3C and Figure 3—figure supplement 1.
elife-24271-fig3-data3.xlsx (100.4KB, xlsx)
DOI: 10.7554/eLife.24271.014

Figure 3.

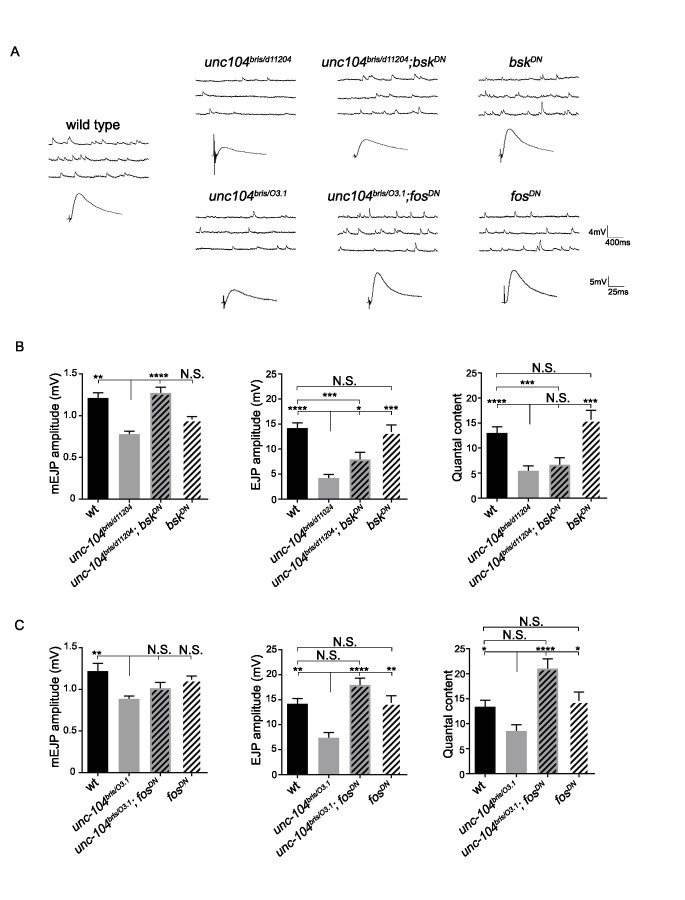
Figure 3—figure supplement 1. Wnd signaling components JNK/Bsk and Fos promotes synaptic transmission defects in unc-104-hypomorph mutants, (related to Figure 3).

Figure 3—figure supplement 1.

(A) Representative electrophysiological traces of mEJP and EJP recorded from muscle 6 of third instar female larvae. The genotypes are: wt (Canton-S), unc-104bris/d11204, bskDN (elav-Gal4;; UAS-bskDN) and unc-104bris/d11204; bskDN (elav-Gal4; unc104bris/d11204; UAS-bskDN), unc-104bris/O3.1, unc-104bris/O3.1; fosDN (BG380-Gal4; unc104bris/d11204; UAS-fosDN) and fosDN (BG380-Gal4;; UAS-fosDN). (B–C) Quantification of mEJP amplitude, EJP amplitude and quantal content (corrected for nonlinear summation). All data are represented as mean ±SEM; N.S., not significant; ****p<0.0001, ***p<0.001, **p<0.01, *p<0.05. Tukey test for multiple comparison.
Figure 3—figure supplement 2. mEJP amplitude is reduced in unc-104 mutants and restored in unc-104; wnd double mutants, (related to Figure 3).
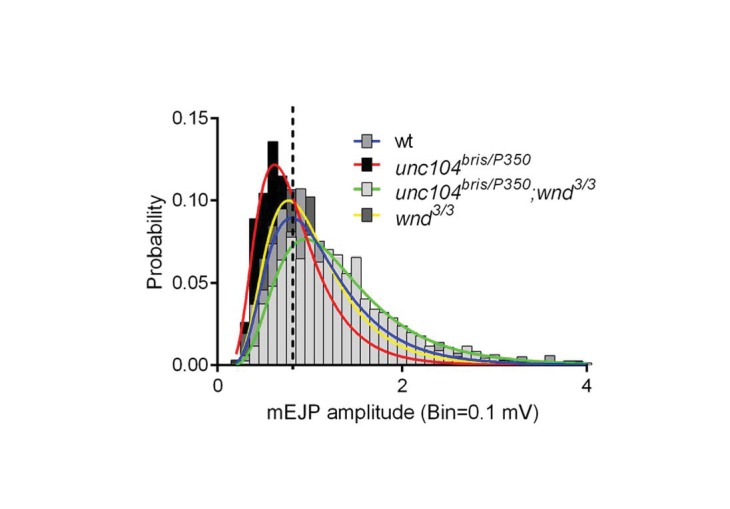
Figure 3—figure supplement 2.

Distribution of mEJP amplitudes fit with log Gaussian. The center amplitude was determined by the peak of curve: wt (Canton S) wild type (0.80 mV), unc104bris/P350 (0.61 mV), unc104bris/P350; wnd3/3 (0.95mV) and wnd3/3 (0.76 mV). Note that both the center amplitude and the amplitude distribution were restored in double mutants.
Figure 3—figure supplement 3. The expression of Unc-104 is barely detectable in unc-104-hypomorph mutants, (related to Figure 3).
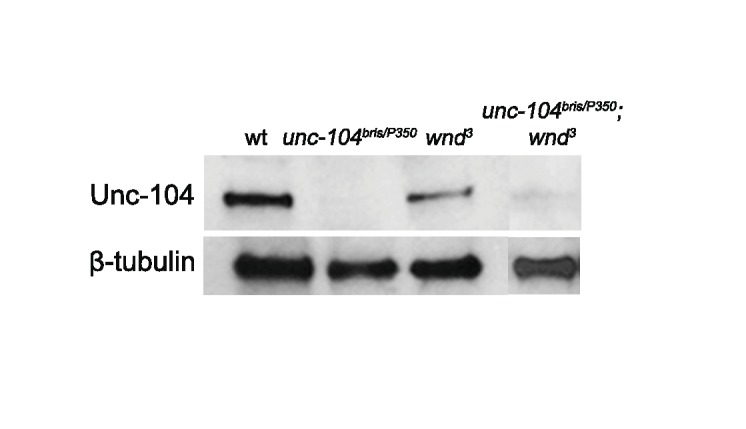
Figure 3—figure supplement 3.

Western blot of larva brains for Unc-104 and β-tubulin for wt (Canton S), unc-104bris/P350, wnd3 and unc-104bris/P350;wnd3.
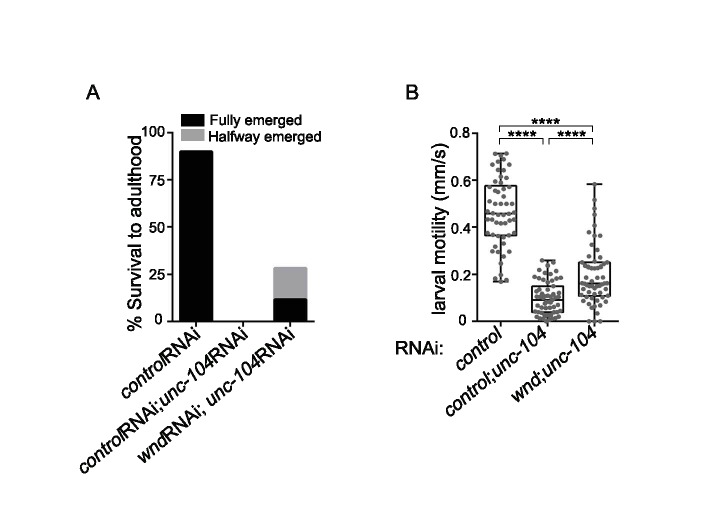
Figure 3—figure supplement 4. Defects in larval motility and lethality of unc-104-hypomorph mutants were only partially suppressed by wnd mutations, (related to Figure 3).

Figure 3—figure supplement 4.

(A) Percentage pupae that survive to adulthood. 60 offspring third instar larvae of indicated genotype were transferred to grape plates and raised at 29°C to increase RNAi knock-down efficiency. The number of adults emerging from pupae were counted over the next 14 days. Adults with anterior the half of their body (head, thorax and foreleg) out of pupae, but with the posterior half body (abdomen and posterior 4 legs) stuck in the pupal case were scored as 'halfway' emerging adults. UAS-RNAi lines were driven by OK371-Gal4. UAS-Octβ2R RNAi and UAS-moody RNAi were used as control RNAi lines for UAS dosage, since no phenotypes were observed for either RNAi line when expressed in in neurons. The percentage survival was measured as the number of emerged or halfway emerged adults divided by the total number of larvae. (B) Motility of third instar larvae was quantified from 2 min videos (30 frames per second). After selection of each genotype animals put on grape plates for 1 hr to adapt before recording. For each larva, the distance and time traveled after it was released in a new plate and before it reached the plate walls was measured with the MB-Ruler (Markus Bader). A marker point in the middle of movement was only applied if the larva moved 45 degree away from the current direction and 2–5 marker points were set to determine the path. A total of 60 larvae were recorded and analyzed for each genotype. UAS-RNAi lines were driven by OK371-Gal4, as in (A). All data are represented as mean ±SEM; N.S., not significant; ****p<0.0001, ***p<0.001, **p<0.01,*p<0.05; Tukey test for multiple comparison.