. 2017 Sep 19;6:e24271. doi: 10.7554/eLife.24271

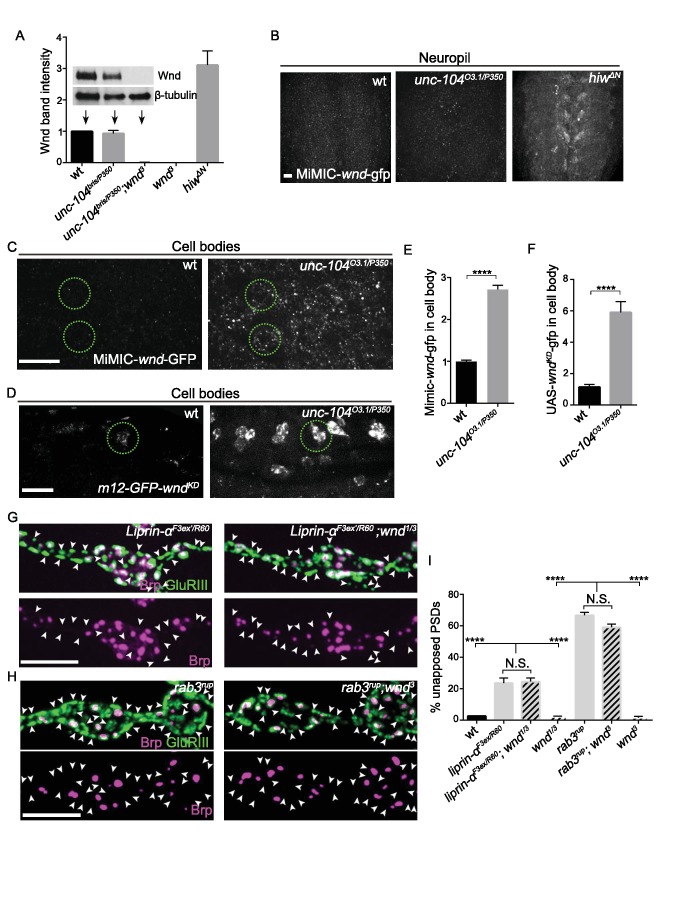
Figure 5. Wnd signaling is activated via an unconventional mechanism in unc-104 mutants.

(A) Representative Western blot of larval whole brain extracts for endogenous Wnd and β-tubulin, and quantification of Wnd levels normalized to β-tubulin band intensity (n ≥ 3). Mutants examined include unc-104bris(hypomoprh)/P350(null), wnd3 and hiwΔN. (B) Images of larval ventral nerve cords from MiMIC-wnd-GFP animals immunostained for GFP. Note the increased neuropil signal in hiw mutants, but not control or unc-104 mutants. This also indicates that the MiMIC-wnd-GFP is, like endogenous Wnd (Collins et al., 2006), subject to regulation by Hiw. (C) Images of motoneuron cell bodies in MiMIC-wnd-GFP animals immunostained with antibody against GFP. Compared to (B), these images are collected in a higher magnification and focal plane to view the motoneuron cell bodies. Two representative cell bodies are marked by green circles. At least 6 animals were examined per genotype. (D) Images of SNc motoneuron cell bodies via live-imaging in larvae expressing UAS-GFP-wndkd (which is kinase dead to avoid pathway activation) driven by m12-Gal4. A representative cell body is marked by a green circle. At least 6 animals were examined per genotype. (E–F) Quantification of GFP signal intensity from (C–D) in cell bodies, normalized to wt (control) animals. Note that ectopically expressed GFP-wnd kinase dead protein has a higher basal expression level which allows for increased sensitivity in detecting changes to Wnd protein. (G–H) Representative images of presynaptic Brp and postsynaptic GluRIII from (G) liprin-αF3ex/R60 and liprin-α F3ex/R60;wnd1/3 and (H) rab3rup and rab3rup;wnd3. Unapposed GluRIII-labeled PSDs are highlighted by arrowheads. Wt is Canton S.. (I) Percentage of unapposed GluRIII-labeled PSDs from (G) and (H). All data are represented as mean ±SEM; N.S., not significant, ****p<0.0001; Tukey test for multiple comparison; Scale bar (B–D) 20 μm and (G–H) 5 μm. For additional data, see Figure 5—figure supplements 13.

Figure 5.

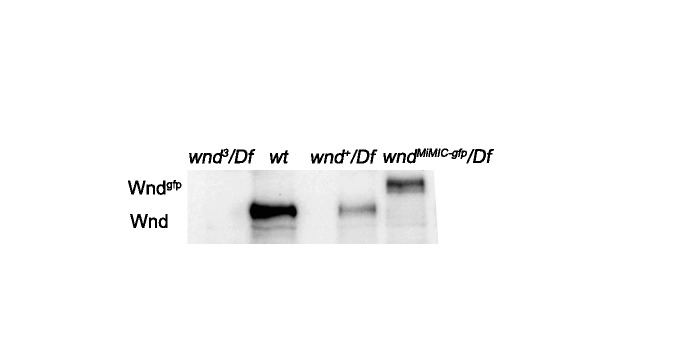
Figure 5—figure supplement 1. MiMIC-Wnd-GFP is a fusion protein of Wnd and GFP, (related to Figure 5).

Figure 5—figure supplement 1.

Western blot with anti-Wnd antibody for larval brain extracts from wnd3/Df, wt, wnd+/Df and wndMiMIC-GFP/Df animals. Endogenous Wnd protein runs at approximately 130 kDa, while the MiMIC-Wnd-GFP fusion protein can be detected at an appropriately larger molecular weight (160 kDa) for the GFP-fusion, confirming the expression and stability of the fusion protein. 20 adult brains were processed for each sample.
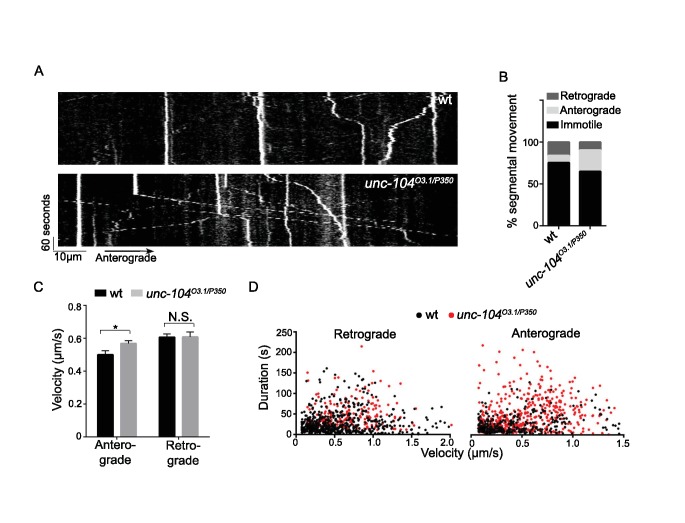
Figure 5—figure supplement 2. Wnd transport was not impaired in unc-104 mutants, (related to Figure 5).

Figure 5—figure supplement 2.

(A) Kymograph of GFP-wndKD particle movement in SNc motoneuron axons (using the m12-Gal4 driver). Axons were imaged 900 μm distal to cell bodies at 0.3 Hz for 5 min in wt (m12-Gal4, UAS-GFP-wndKD) and unc-104O3.1/P350 mutant animals. Anterograde particles (which were more abundant in unc-104 mutants) moved from left to right. (B–D) Measurement of GFP-wndKD particle movement by (B) the distribution of particles across retrograde, anterograde and immotile categories, (C) velocity, and (D) scatter plot showing both duration (y-axis) and velocity (x-axis) of all anterograde and retrograde particles. In unc-104 mutants anterogradely-moving particles are more abundant and move in longer duration at higher velocity. All data are represented as mean ±SEM; N.S., not significant, ***p<0.001, **p<0.01, *p<0.05, Tukey test for multiple comparison.
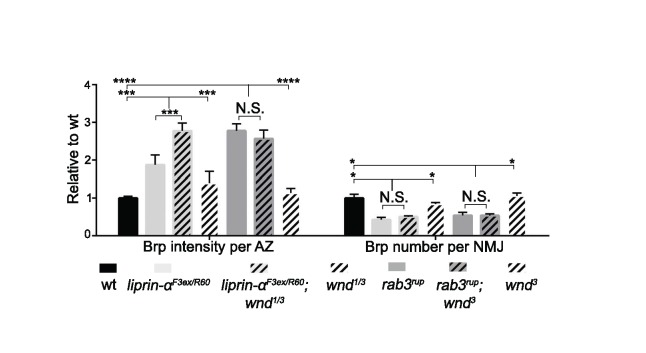
Figure 5—figure supplement 3. Liprin-α and Rab3 control presynaptic assembly independently of Wnd, (related to Figure 5).

Figure 5—figure supplement 3.

Quantification of Brp intensity at individual AZs (intensity per AZ) and the number of Brp puncta per NMJ. Both liprin-α and rab3 mutants showed increased Brp intensity at individual AZs and a reduction in total number of Brp puncta. These phenotypes were not suppressed by wnd mutations. All quantification is normalized to wt (Canton S). All data are represented as mean ±SEM; N.S., not significant; ****p<0.0001, ***p<0.001,*p<0.05, Tukey test for multiple comparison.