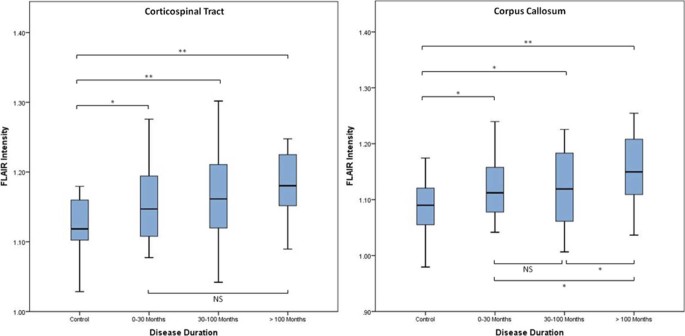
Figure 2.
FLAIR intensity in controls vs patients (including all ALS, flail arm, and PLS patients) stratified according to disease duration. All comparisons by independent samples t testing, two tailed. *P ≤ 0.05; **P ≤ 0.01; ALS, amyotrophic lateral sclerosis; FLAIR, fluid-attenuated inversion recovery; NS, nonsignificant; PLS, primary lateral sclerosis.

