. 2017 Jul 7;6:e23539. doi: 10.7554/eLife.23539

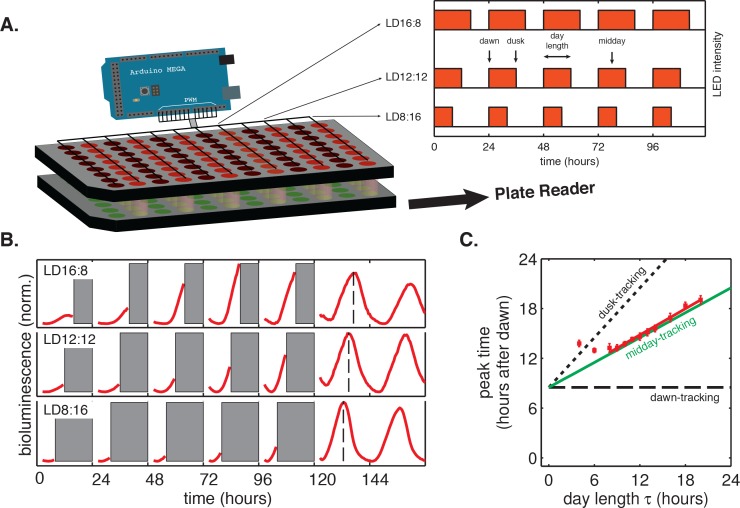
Figure 1. Phase of the cyanobacterial circadian rhythm scales linearly with day length.

(A) LED array device used to grow S. elongatus in programmable light-dark cycles. Cells grown in a 96-well plate on solid media (lower plate, green circles) are illuminated from above by LEDs (red circles). An Arduino microcontroller is used to dynamically change LED intensity in different columns of the plate (inset). Luminescence from the bottom plate is read out every 30 min on a plate reader. Drawing not to scale. (B) Drive-and-release strategy to measure phase of the circadian clock under light-dark (LD) cycling. Cells were exposed to five entraining LD cycles and then released into constant light. Bioluminescence signals (PkaiBC::luxAB) from each well were separated into individual ‘day’ and ‘night’ windows. Data from night portions of the experiment were omitted from analysis (gray bars), and data from the day portions of the experiment were aligned to zero baseline and normalized to unit variance. Dashed lines indicate time of peak reporter signal calculated by parabolic fitting. See Computational methods for details. (C) Peak time of bioluminescence (PkaiBC::luxAB) in light-dark cycles of different day length (red squares) was quantified by local parabolic fitting around the first maximum of the oscillation after release into constant light. Error bars represent standard deviations of peak time estimates from technical replicates (n = 4–8). Slope of the linear fit (red line, m = 0.53 ± 0.01) was determined by linear regression. Dashed and dotted black lines indicate scaling of phase with day length for dawn- and dusk-tracking oscillators; green line indicates midday-tracking behavior.

DOI: http://dx.doi.org/10.7554/eLife.23539.003

Figure 1—source data 1. Source data for Figure 1B.
DOI: 10.7554/eLife.23539.004
Figure 1—source data 2. Source data for Figure 1C.
DOI: 10.7554/eLife.23539.005
Figure 1—source data 3. Source data for bioluminescence trajectories in Figure 1—figure supplement 1.
DOI: 10.7554/eLife.23539.006
Figure 1—source data 4. Source data for Kendall’s τ correlations in Figure 1—figure supplement 1.
DOI: 10.7554/eLife.23539.007
Figure 1—source data 5. Source data for Figure 1—figure supplement 2A–E.
DOI: 10.7554/eLife.23539.008
Figure 1—source data 6. Source data for Figure 1—figure supplement 3A, showing bioluminescence output from the purF repoter.
DOI: 10.7554/eLife.23539.009
Figure 1—source data 7. Source data for Figure 1—figure supplement 3B.
DOI: 10.7554/eLife.23539.010

Figure 1.

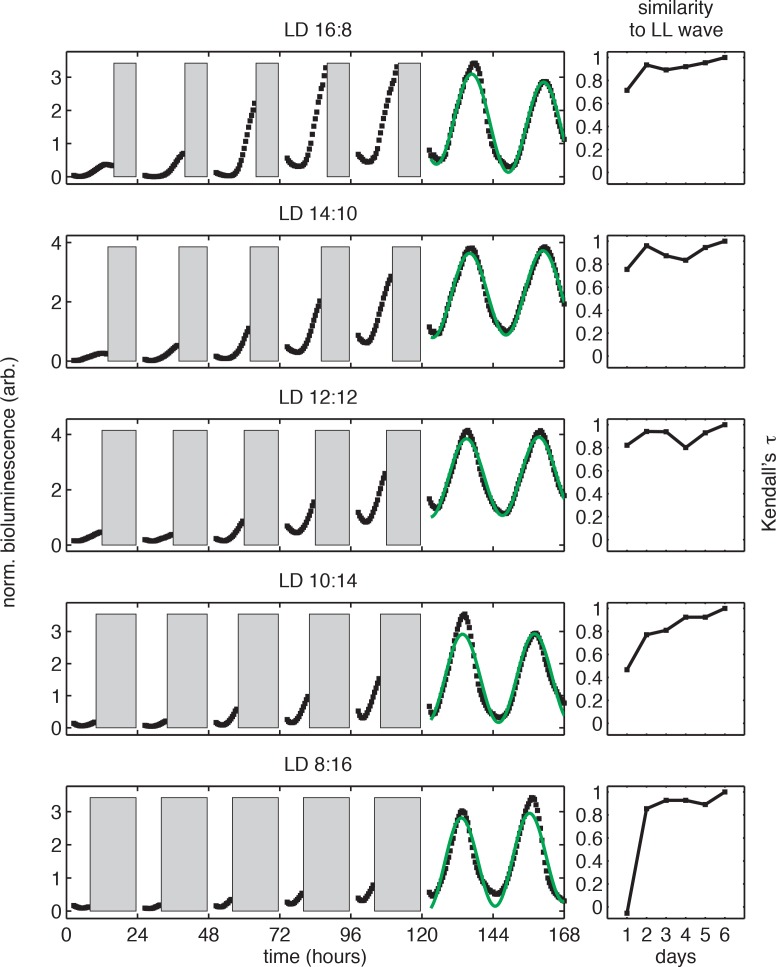
Figure 1—figure supplement 1. Bioluminescence recordings from PkaiBC::luxAB reporter in light-dark cycles.

Figure 1—figure supplement 1.

(left) Selected bioluminescence traces (PkaiBC::luxAB, black) recorded from individual wells of the 96-well LED array device in conditions simulating day-night cycles of different day length (same dataset as in Figure 1B–C). Data recorded in the dark (gray bars) and in the first two hours after lights-on were omitted from analysis. Each trajectory was normalized to the mean and variance of the bioluminescence signal recorded after the release into constant light, and trajectories recorded after release into constant light were fit to sinusoids (green). For illustration purposes here, trajectories were aligned to zero baseline. See Computational methods for fitting details. (right) Similarity between the bioluminescence rhythms (PkaiBC::luxAB) recorded during light-dark entrainment and after release into free running conditions. Nonparametric correlation coefficient (Kendall’s τ) between bioluminescence trajectories recorded in the light during entrainment (days 1–5) and the corresponding time period after release into constant light (e.g. a 16-hr window in LL for LD 16:8). See Computational methods for details.

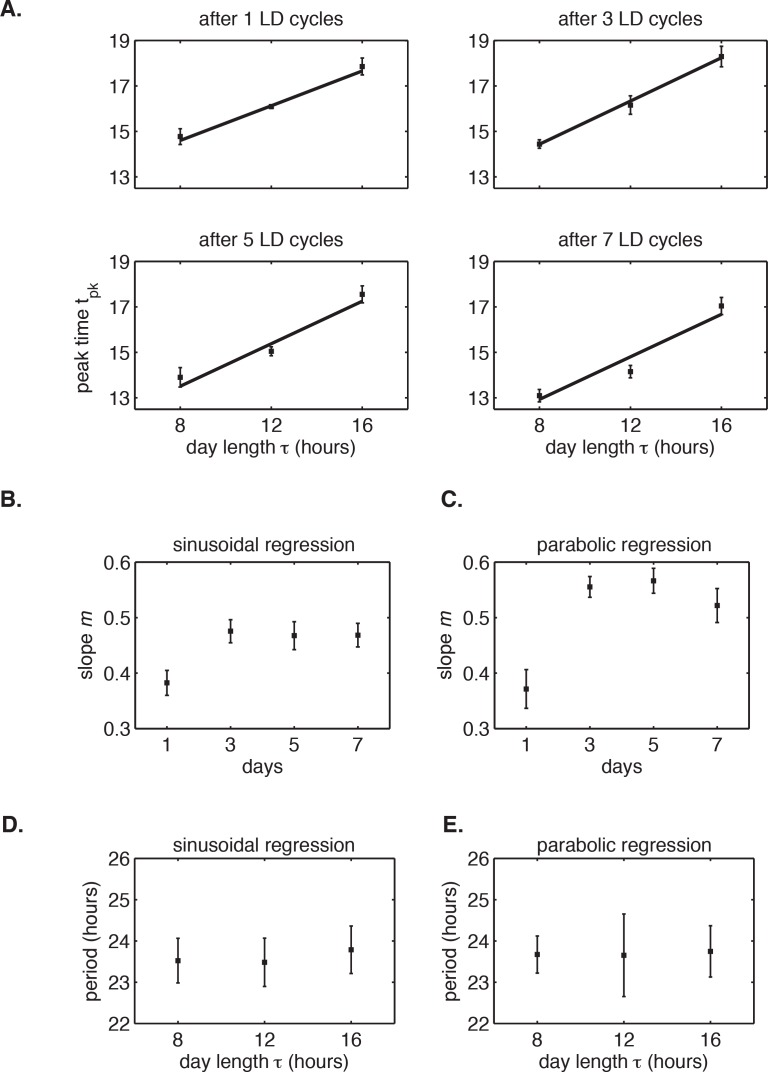
Figure 1—figure supplement 2. The circadian rhythm of S. elongatus rapidly entrains to 24 hr diurnal cycles with 8–16 hr of daylight.

Figure 1—figure supplement 2.

(A) Peak times of PkaiBC::luxAB reporter after release into LL from 1 to 7 LD cycles of different day length (LD 8:16, LD 12:12 or LD 16:8), as estimated by sinusoidal regression. Error bars represent the standard deviation (σ) of technical replicates (n = 6–8 replicates per condition). Lines mark linear fits to the data. (B) Slope m of clock phase scaling with day length stabilizes after three light-dark cycles. Slope of linear fits in (A) plotted against day length in diurnal cycles. Error bars mark uncertainty in fit slope (±σ). (C) Slope m of clock phase scaling with day length, as estimated by parabolic regression (see Computational methods). (D and E) Free-running period of PkaiBC::luxAB reporter rhythms, as estimated from sinusoidal fits (D) or local parabolic fits (E), recorded in continuous light after entrainment to 24 hr cycles with 8, 12, or 16 hr of daylight.

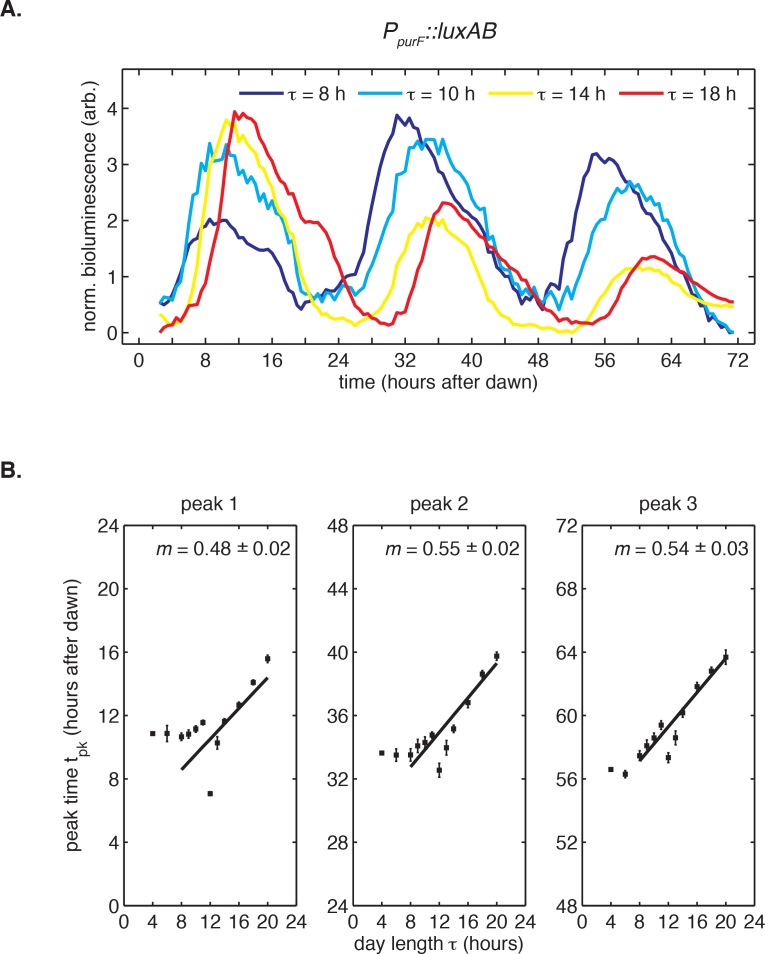
Figure 1—figure supplement 3. Bioluminescence recordings from PpurF::luxAB reporter in light-dark cycles.

Figure 1—figure supplement 3.

(A) Rhythms in bioluminescence in continuous light recorded from a dawn gene reporter (PpurF::luxAB) after entrainment to 24 hr light-dark cycles of different day length τ (LD 8:16, LD 10:14, LD 14:10, LD 18:6). Following the protocol in Figure 1, cells received five light-dark cycles and were then placed under continuous illumination. Bioluminescence trajectories from first 72 hr after release into constant conditions were aligned to zero baseline and normalized to unit variance. (B) Peak times of the PpurF::luxAB reporter in constant light after entrainment with five LD cycles of different day length (LD 4:20 to LD 20:4). Peak times were determined by local parabolic regression (see Computational methods). Error bars represent standard errors of technical replicates (n = 4–8). Straight lines represent linear fits to data from wells entrained to day lengths at least 8 hr long.