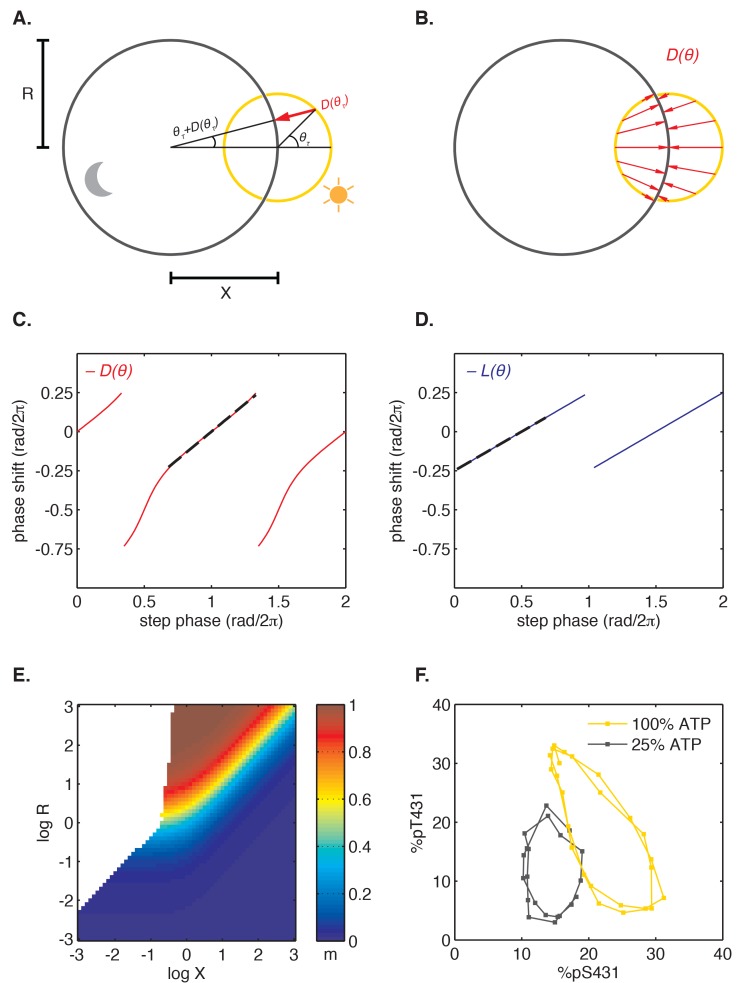
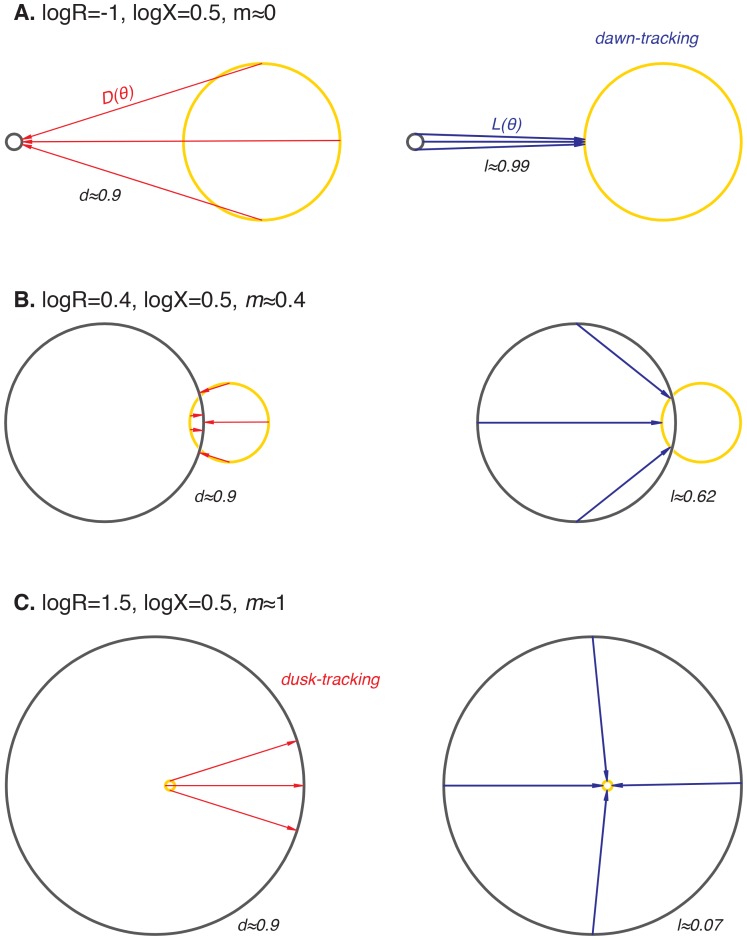
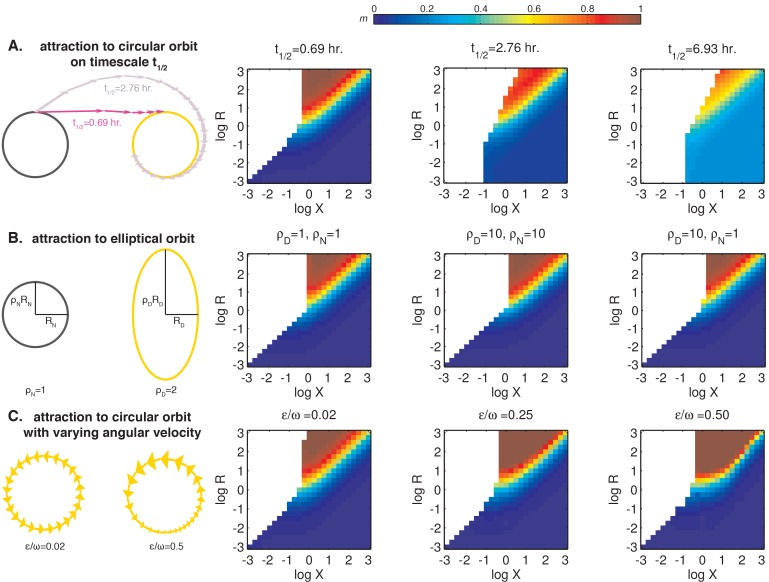
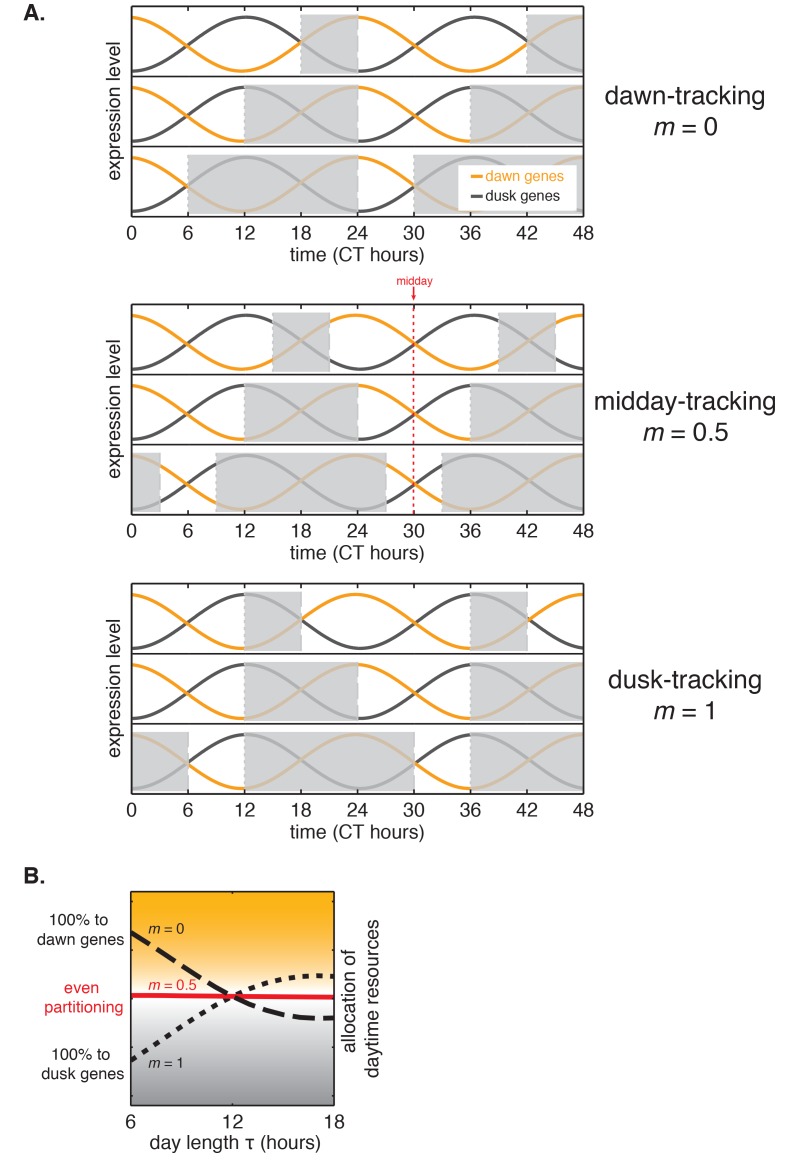
Figure 6. Nearly linear step response functions can arise from the relative geometry of day and night limit cycles.
(A) Geometric model of oscillator phase resetting. During the day, the oscillator runs with constant angular velocity along the daytime orbit (yellow), which has unit radius and is centered at the origin. At dusk, the oscillator transits to the nighttime orbit (black), which has radius R and is displaced from the daytime orbit by X units. In the limit where the nighttime orbit is strongly radially attracting, we can approximate oscillator response to the light-dark transition (, red arrow) as an instantaneous jump from phase on the daytime orbit toward the center of the nighttime cycle, resulting in phase on the night orbit. (B) Simulation of oscillator phase shifts due to light-dark transitions at different phases on the day orbit (red arrows) for R = 2, X = 2. For geometries with X ≈ R, phase angles on the day orbit are compressed to an arc on the night limit cycle that subtends a smaller angle. See Computational methods for calculation details. (C and D) Simulations of and step response functions arising from the geometric arrangement of day and night cycles in (B). Linear regions of and are marked with black dashes. See Computational methods and Appendix 1 for calculation details. (E) Heat map of the slope m of the approximately linear relationship between entrained phase and day length, plotted as a function of X and R. In white regions, the oscillator does not entrain stably or the oscillator does not show linear scaling of phase with day length. Slope determined from simulations of oscillator entrainment to 24 hr driving cycles of day length τ = 6–18 hr. See Computational methods for details. (F) Limit cycles traversed by the KaiABC oscillator in vitro in metabolic conditions mimicking day (yellow, [ATP]/([ATP]+[ADP]) ≈ 100%) and night (black, [ATP]/([ATP]+[ADP]) ≈ 25%). Oscillations in KaiC phosphorylation on Ser431 and Thr432 are replotted from data in Phong et al. (2013).


