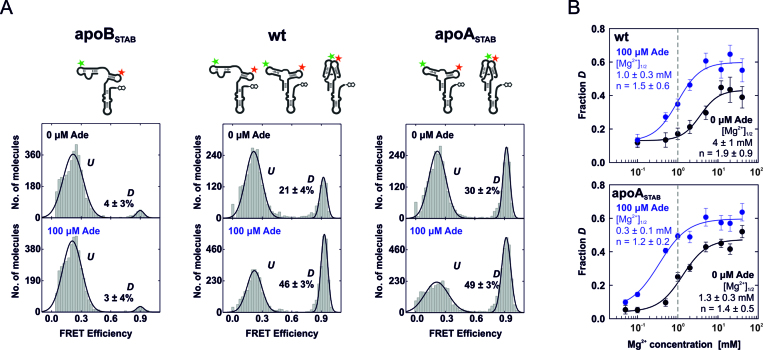
Figure 3.
Mutational smFRET analysis of aptamer docking of the full-length add Asw. (A) FRET histograms of L2/L3-labeled apoB-stabilized (apoBSTAB), wildtype (wt) and apoA-stabilized (apoASTAB) add Asw in absence and presence of 100 μM adenine at 2 mM Mg2+. A schematic representation of each variant in the apo conformations is depicted above. The fractional population of the docked state D is indicated in percent. (B) Fractional population of D in wt and apoASTAB as a function of the Mg2+ concentration without adenine (black) and with 100 μM adenine (blue). The data have been fitted using the Hill equation to obtain the Mg2+ concentration for half-maximal docking [Mg2+]1/2 and the Hill coefficient n. The dashed line indicates near-physiological free Mg2+ concentration (∼1 mM).

