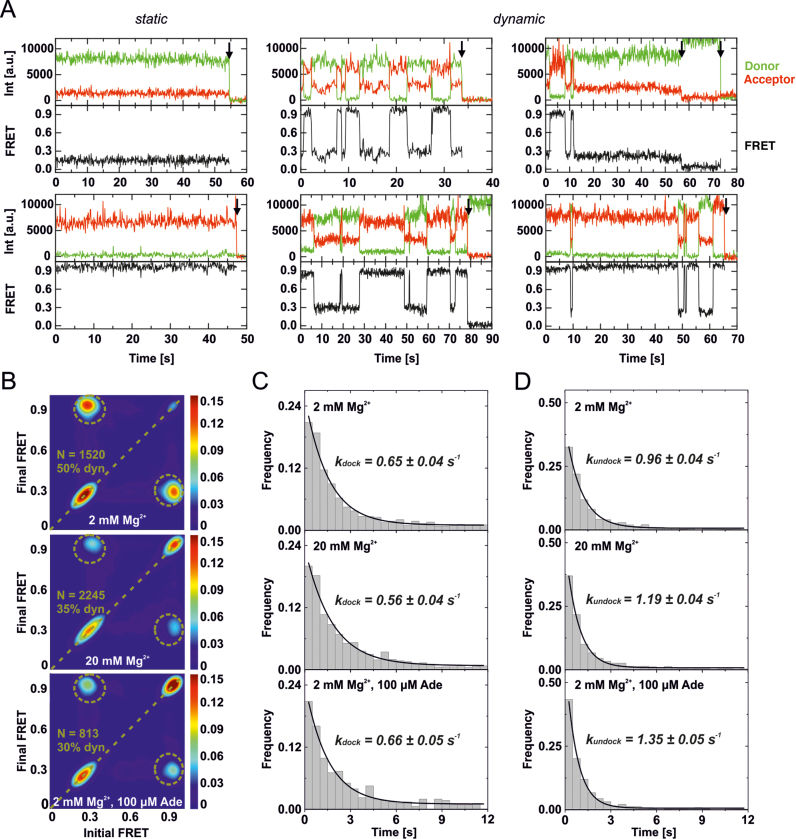
Figure 4.
Mg2+- and adenine-dependent aptamer docking dynamics of the full-length wt add Asw analysed by smFRET. (A) Representative smFRET time traces of L2/L3-labeled wt collected at 2 mM Mg2+ without adenine. The aptamer domain of single riboswitches either statically remained in a long-lived undocked or docked state (left panel), or exhibited dynamics between short-lived and long-lived undocked and docked states (middle and right panel). Photobleaching events are indicated by a black arrow. (B) Transition occupancy density plots (TODPs) for smFRET traces collected at 2 mM Mg2+, at 20 mM Mg2+ and at 2 mM Mg2+ with 100 μM adenine. The fraction of molecules that exhibited dynamics (dyn) is indicated in percent. N indicates the number of traces included in each TODP. (C) Dwell-time histograms of the undocked state created from the dynamic smFRET traces designated in the corresponding TODP in (B). The data were fitted using single-exponential decay functions to extract the indicated docking rate constants. (D) Dwell-time histograms of the docked state created from the dynamic smFRET traces designated in the corresponding TODP in (B). The data were fitted using single-exponential decay functions to extract the indicated undocking rate constants.

