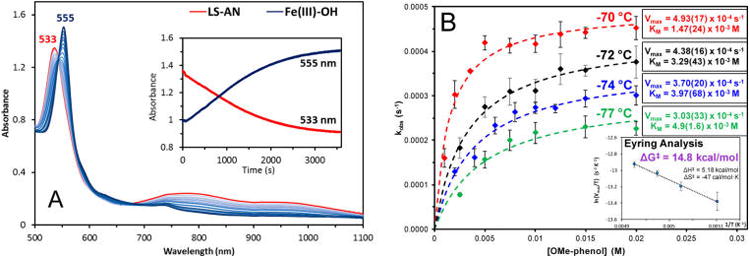
Figure 14.

(A) Absorption spectra during the reaction of the LS-AN complex (1) (0.1 mM, −70 °C, MeTHF) (red) with >50 equiv 4-methoxyphenol to form the F8FeIII–OH final products (blue). (A, inset) Time evolution of absorption changes corresponding to 1 (533 nm) and FeIII–OH (555 nm). (B) Plots of initial reaction rate (monitored at 555 nm) dependence on phenol concentration at −70, −72, −74, and −77 °C, including Michaelis–Menten parameters for each temperature. (B, inset) Eyring analysis of the kinetic data, using the Vmax for each temperature.
