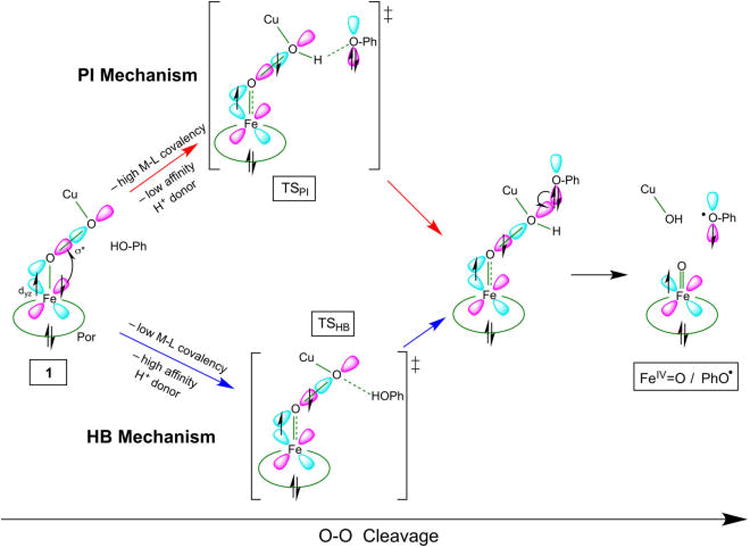
Figure 16.

Schematic representation of the two mechanisms for O–O cleavage of 1, where the favored mechanism is dictated by M–L covalency and H+ affinity of the donor. Both mechanisms involve β ET from Fe before the barrier, and α ET from phenolate after the barrier (see text).
