
Figure 6.
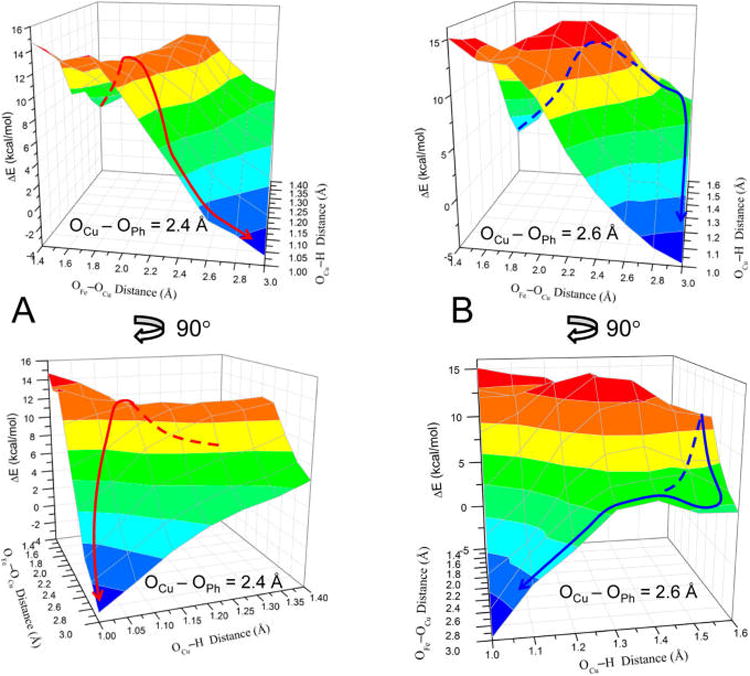
PESs for OFe⋯OCu vs OCu⋯H(OPh) distances (with fixed OCu⋯OPh), where the top/bottom plots are rotated ∼90° from each other to show the full surface. (A) OCu⋯OPh = 2.4 Å; the red line represents an approximate reaction pathway through the proton-initiated TS (TSPI). (B) OCu⋯OPh = 2.6 Å; the blue line represents an approximate reaction pathway through the H-bonded TS (TSHB). All energies are relative to the structure with OCu⋯OPh = 2.6 Å, OFe–OCu = 1.4 Å, and OCu⋯H(OPh) = 1.6 Å (which is set to 0 kcal/mol). Dashed lines are used to indicate that the path is behind the surface.