
Figure 7.
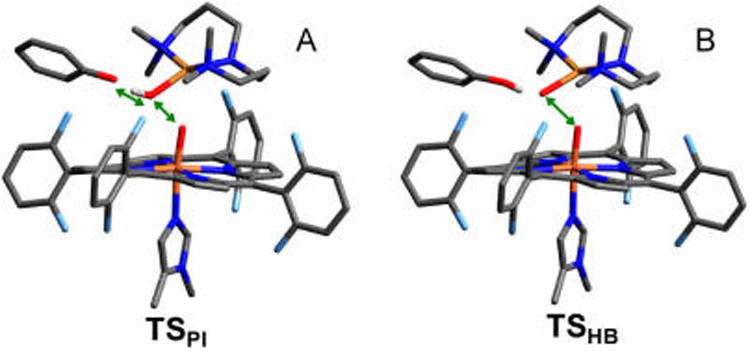
Geometric structures for (A) the transition state along the proton transfer pathway (TSPI), and (B) the transition state along the H-bond-assisted O–O homolysis pathway (TSHB). Green arrows illustrate the dominant motion in the imaginary frequency. Bond distances are given in the SI, Table S1. H-atoms have been removed for clarity (except the phenolic H).