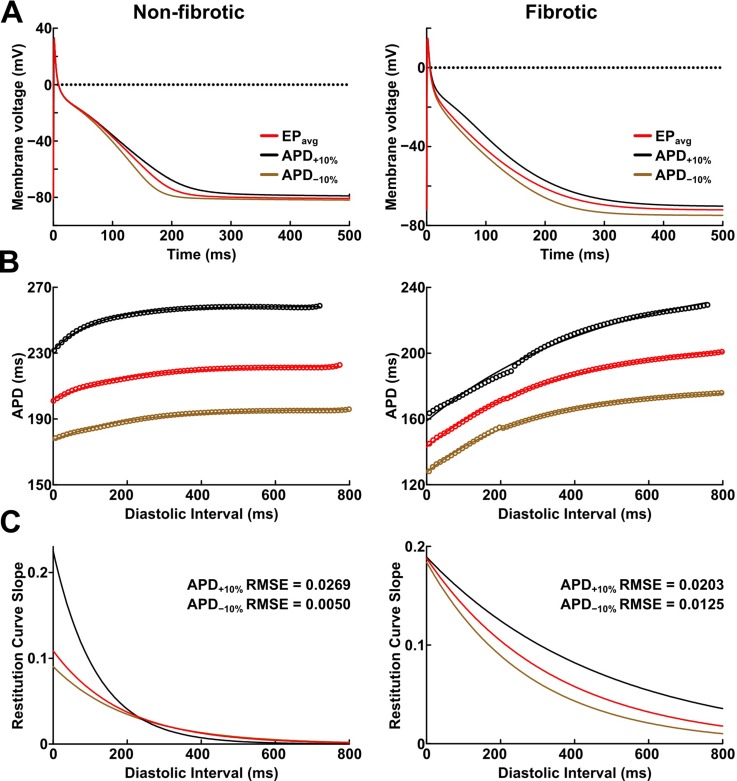
FIG. 1.
(a) Action potential (AP) traces for simulated non-fibrotic (left) and fibrotic (right) atrial myocytes, paced to steady-state (1000 stimuli at basic cycle length = 500 ms) under average human AF electrophysiology (EPavg) conditions and with AP duration (APD) variability (±10%). (b) APD restitution relationships for the respective cell types shown in A. Fit lines obtained via exponential regression. (c) Plots showing APD restitution curve slope values for different diastolic intervals. Root mean squared error (RMSE) values between APD±10% and EPavg curves are shown.

