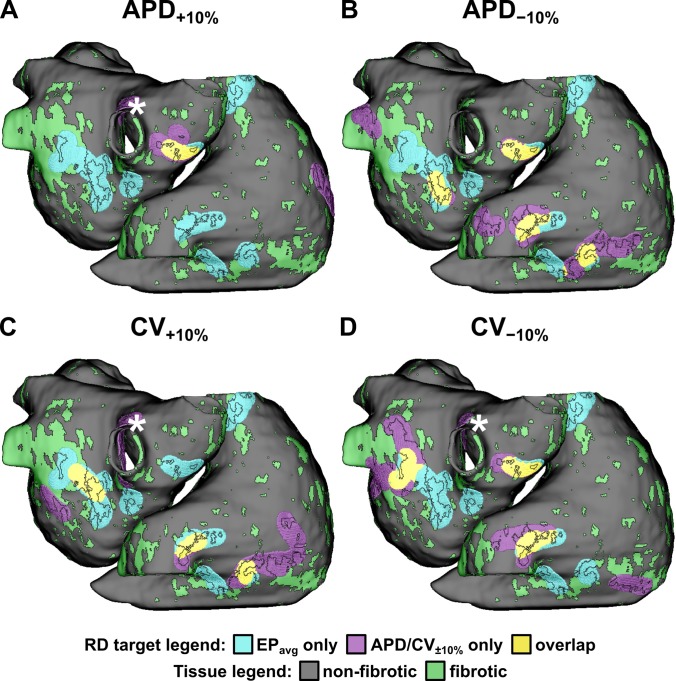
FIG. 3.
Schematic showing the distribution of fibrotic tissues and the degree of overlap between RD targets from simulations with EP parameter variation and EPavg cases for one atrial model (P01). Similar schematics for all 11 other atrial models can be found in the supplementary material (Figs. S1–S11). RD targets are defined as the volume within 3.5 mm surrounding each observed RD trajectory. Fibrotic tissue regions (green) are shown, with boundaries (black lines) superimposed on RD targets to facilitate the visualization of RD trajectories with respect to patient-specific spatial pattern of remodeling. * indicates the ablation target for an RD in the right pulmonary vein area that emerged under 3/4 variable EP conditions, but never in simulations with EPavg.

