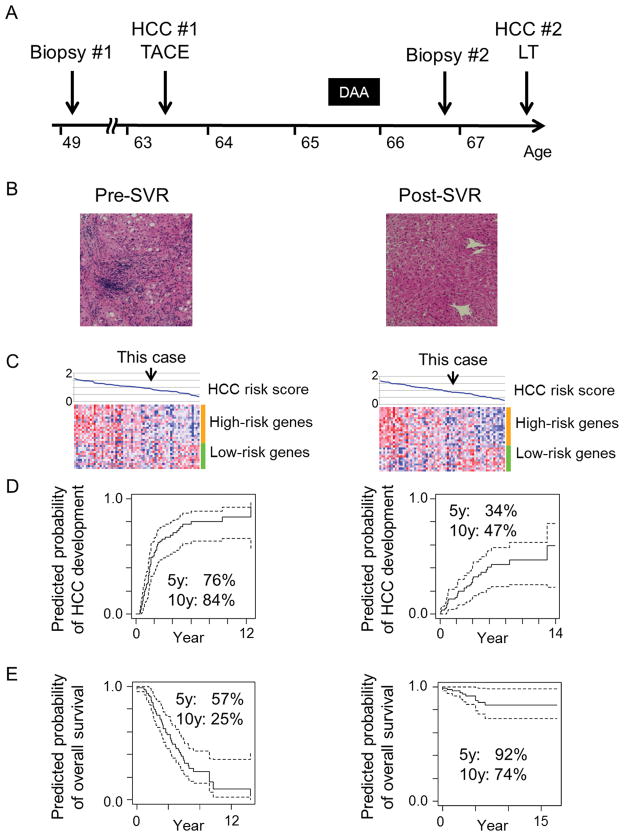
Figure 1.
(A) Timeline of clinical events. (B) H & E staining of liver biopsy tissue pre- and post-SVR. (C) Expression pattern of the HCC risk gene signature in the reference series of pre- (n=63) and post- (n=64) SVR patients. Samples (columns) were ordered according to the HCC risk score calculated from the gene signature as a relative measure within the normalized range between 0 and 2 in the respective reference patient series as previously described.(2) Red and blue colors in the heatmap indicate high and low relative gene expression after sample-wise standardization by subtracting mean and dividing by standard deviation, respectively. (D) Predicted probability of HCC development using a Cox regression model based on the HCC risk score. Dashed lines indicate 95% confidence interval of the predicted probability. (E) Predicted probability of overall survival.

