
Figure 7.
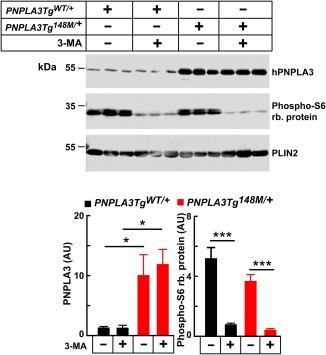
Hepatic PNPLA3 levels in 3‐MA–treated mice expressing human PNPLA3‐WT and ‐148M. Male PNPLA3TgWT/+ and PNPLA3Tg148M/+ mice (n = 3 per group, age 11‐13 weeks) were fed an HSD for 1 week. Feeding was synchronized (protocol 1), and at the end of the third feeding cycle, the mice were treated with 3‐MA (15 mg/kg) and fasted for 3 hours before being killed. LDs were harvested from the liver and immunoblotting was performed as described in Materials and Methods. Phospho‐S6 ribosomal protein was used as a positive control. The data are representative of two independent experiments. Each bar represents the mean ± SEM. Levels were compared among lines using a Student t test. *P < 0.05. ***P < 0.001.