
Figure 7.
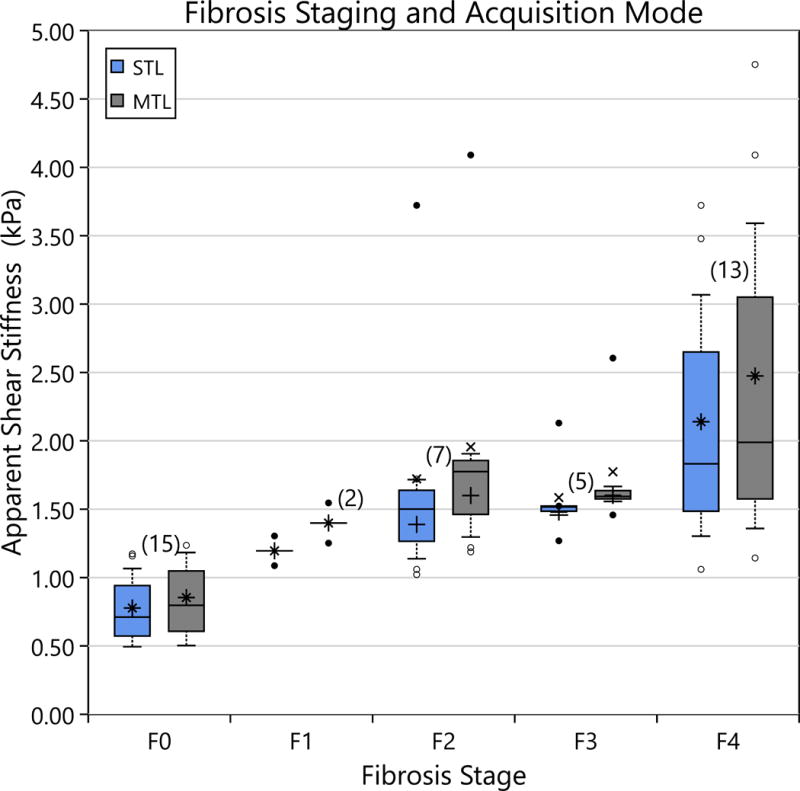
The apparent shear stiffness as a function of Fibrosis stage is shown for rat liver median lobes. Box plots are as described in Figure 4. A significant difference is demonstrated between the mean stiffness of F0 rats and the other stages. There is no demonstrable difference in STL vs. MTL performance in differentiating fibrosis stages.